


Introduction
In an era where cloud environments expand ever faster and security telemetry grows exponentially, enterprise security teams face a paradox: more data means more potential insight, but also more SIEM costs! In this customer success story, we talk about a forward-looking global organization using Splunk as their SIEM, facing this challenge, and how they solved it with Amazon Security Lake and Query.
Their story is not about the replacement of Splunk. Instead they chose a practical path where analysts continue to leverage Splunk as their primary security console extended to reach data stored in Security Lake, operationalized via the Query Security Data Mesh.
Customer Environment and Problems To Solve
This is a modern enterprise with a cloud-first posture heavily built on AWS. Their cloud infrastructure is global and distributed across 16 AWS regions. They are in one of the most heavily regulated industries where their viable path to meet all their compliance needs is to keep data in the local region. The SOC uses Splunk Cloud as their primary platform but it had limited visibility to their vast AWS infrastructure.
Over the last year, the organization adopted and started logging their cloud infrastructure logs into Amazon Security Lake in each of the 16 regions locally. This includes sources like CloudTrail, Route 53, VPC Flow Logs, AWS WAF logs, and EKS audit logs. This is a huge amount of data that they started logging initially for compliance purposes.
The security team did not have direct access. They had to log tickets to engineering with details of the subset of data they were interested in, and then the engineering team would run Athena queries manually on individual sources, export results, and make them available via the ticket workflow.
Their current need was to make this data directly accessible to their security team for threat hunting and incident response. They felt it was not practical to ingest the large amount of data into Splunk from a cost perspective. Another issue they were facing was the regulatory obstacle in centralizing in one Amazon Security Lake region.
The complexities of their current environment had made it extremely difficult to get to their desired outcome, so they were exploring and reviewing whether they needed to re-architect, and if so, how. The CISO formalized the project into a quarterly goal to explore, review, and test possible solutions.
Project Requirements and POC Candidate Short-Listing
The project started with their architect exploring what solutions exist for their scenario. The desired solution would need to meet the following requirements:
- Use data from the compliance repository in Amazon Security Lake.
- Do not move data out of the international regions. Analysts authorized for a given international region would connect and investigate in-place.
- Provide an interactive security console with an interface that can run analysts’ use-cases easily. Manually running SQL through Amazon Athena would not be a desirable solution.
- Analysts should be able to run a single search across their authorized regions and data sources, vs manually running separate individual searches across each source. The solution should be able to automatically break and distribute the search into individual queries, run them in parallel, and normalize and collate results.
- Analyst-defined detections should be supported. They should be able to define/customize/reuse detections to be run on the security data mesh. They already had a library of detections built for the data in Splunk which they would like to apply to the sources in Security Lake.
- At a minimum, the solution needs to support and onboard the security data collected from CloudTrail, Route 53, VPC Flow Logs, AWS WAF logs, and EKS audit logs. It should be possible to expand support to new log sources as needed.
- Their expected data growth year over year is in the double digits but in a difficult to predict, wide range. The solution’s licensing should be cost-effective and predictable for that growth scenario.
The next step was to short-list the candidates to POC. This is how they found and shortlisted two vendors – Splunk’s own federated search and the Query Security Data Mesh:
- Splunk Federated Search:
- Being a Splunk customer already, the CISO wanted the team to test whether staying in Splunk’s own ecosystem of products could meet their needs.
- See here to learn more about Splunk federated search
- The Query Security Data Mesh:
- The architect did some web research and came across the Query website. Query lets users access, use, and get answers from security-relevant data, wherever it is stored. Query also has a Splunk app that looked promising to him because it could enable search, visualization and analytics from the Splunk console without moving data out of Security Lake.
- See here to learn more about Query.
Initial Scoping of POC
The customer scoped the POC as:
- POC setup and testing would be done in three regions instead of all 16. This included their largest US HQ region.
- POC data sources will be limited to three sources already present in Security Lake: CloudTrail, Route 53, and VPC Flow Logs in each of the regions.
- The test plan captured scenarios to validate the seven requirements mentioned above. Most importantly, the analyst should be able to select and run a single search both individually and across any combination of the three regions and three sources. Typical testing inputs would include entity and IOC searches along with filtering conditions on specific event attributes. For example:
- Find internal IPs that have communicated with a suspicious domain.
- Find which users accessed/modified a particular cloud resource.
- The remaining 13 regions and other data sources would be onboarded upon production deployment.
NOTE ABOUT COLLECTING INTO SECURITY LAKE: Collecting logs from different AWS services and storing them in Amazon Security Lake was already being done by the customer and was not part of the POC scope. Their different AWS services’ logs were getting collected into AWS Glue managed database tables and stored in Security Lake in Parquet format. To reference standard Security Lake collection steps, please see Collecting data from AWS services in Security Lake. To reference collecting from non-AWS services as well, please see Collecting data from custom sources in Security Lake. Also note that Query has a separate product called Security Data Pipelines that pipelines data from 50+ third-party sources to send and store in common lakes like Amazon Security Lake.
First POC: Splunk Federated Search
Being an existing Splunk customer, the organization proceeded to test Splunk’s own federated search solution first. Depending upon the specific use-case, Splunk actually has two different ways of providing a solution – Federated Analytics (for detections) and Federated Search (for hunting / ad hoc searching). These choices are documented in more detail in Splunk docs here.
Early in the POC, the customer realized that they would need to do both:
- For Detections (requirement #5 above):
- To enable detections on Security Lake data, the only path from Splunk is the Federated Analytics option. Based upon detection needs, that requires ingesting filtered Amazon Security Lake data into their Splunk. The detailed steps are not provided directly in this blog but can be referred to in Splunk docs in sub-pages of About Federated Analytics
- Pretty soon in the POC, while defining and testing their detection use-cases, the analysts realized that they would have to ingest a majority of their Security Lake data into Splunk. It was hard to estimate an exact percentage, but they knew it would need to be reworked (and hence repriced) in their licensing, as new detection scenarios emerge.
- For interactive searching (requirement #3-4 above):
- With the federated index approach from Splunk, the customer was able to configure and run searches on the Security Lake data. The detailed steps are not provided directly in this blog but can be referred to in Splunk docs at Create the Amazon Security Lake subscriber for federated search access and subsequent pages.
- The customer realized that though the data is hosted in Security Lake (which they are already paying AWS for), they would also have to purchase Splunk’s Data Scan Unit (DSU) entitlements tied to the amount of data scanned by federated searches. (DSUs are purchased in units of 10TB and overages are in units of 1TB, as per Licensed Capacity | Splunk.) This would lead to unpredictable data usage-based pricing that did not meet requirement #7 above.
Overall, Splunk’s solutions didn’t fully solve the problems the customer wanted to address. They would significantly increase licensing costs, keep costs heavily tied to both data volume and usage, would continue to have unpredictable growth, and would tie the customer down further to Splunk.
NOTE: A comparison on the differences between Query & Splunk Federated Search can be found here.
Second POC: Query Federated Search
The Query Security Data Mesh lets users access, use, and get answers from security-relevant data, wherever it is stored. Query can be procured through the AWS Marketplace here. Query also has a Splunk app (see here) that enables search, visualization and analytics from the Splunk console for customers that desire to keep Splunk as the primary interface for their analysts. The app works without needing to index into Splunk and data can stay in Security Lake (and/or in the 50+ other common data sources Query supports). Search, detections and other analytics are run directly against data stored in Security Lake and only results are sent to display in the Splunk console.
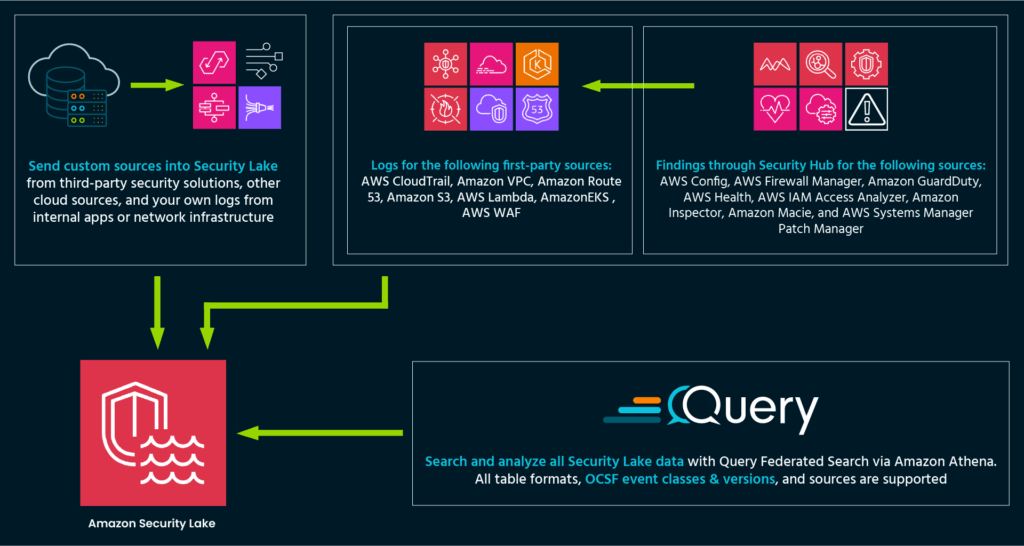
Let’s go through the POC setup, testing, and validation process the customer did with Query.
Setting up Query Connections to Sources in Security Lake
As discussed earlier, the customer already had Security Lake configured and functioning with pipelining of data from the local AWS region’s CloudTrail, Route 53, VPC Flow Logs, AWS WAF logs, and EKS audit logs. The data was cataloged in AWS Glue and stored as parquet files in OCSF format.
For the limited POC scope of three regions and three sources in each region – CloudTrail, Route 53, and VPC Flow Logs – the customer followed the steps below to create an API-based connection that made that source accessible via Query:
CONNECTION STEPS (detailed at Connecting to Amazon Security Lake):
Connection:
- The customer’s AWS admin deployed an IAM Role with a Query-provided external ID to grant permissions to interact with Amazon Athena, AWS Glue, Amazon S3, and AWS KMS (optionally).
- The AWS admin granted
SELECTandDESCRIBEpermissions to the IAM Role within AWS Lake Formation for the relevant database and table in Amazon Security Lake. - See below for an example of a Security Lake connection creation in the Query Console to query from a table holding Route 53 logs:

OCSF Schema Discovery:
Clicking ‘Next’ after providing the required connector info led to the Query Copilot discovering the source data schema and complete the connector configuration:
- Amazon Security Lake stores data normalized to OCSF format. Coincidentally, the Query data model is also based upon OCSF. That makes it very easy for the Query Copilot to auto-discover the OCSF event type and fields by observing a sample data set obtained from the initial connection.
- CloudTrail, Route 53, and VPC Flow Logs are represented via OCSF API Activity, DNS Activity and Network Activity events respectively.
Setting up the Query Splunk App
The customer’s Splunk admin installed the Query Splunk App following this guide. The app made it possible to run federated searches on remote data sources, without needing to index into Splunk. The app extended SPL with | queryai command for searching, and allowed their Splunk users to continue to run their standard SPL pipeline commands.
Use-Case Validations From Splunk Console
Based upon their use-cases, analysts ran live searches from the Splunk console across all the nine Security Lake tables and region combinations. Some of the simpler search command examples the team ran are reflected here:
ENTITY SEARCHES
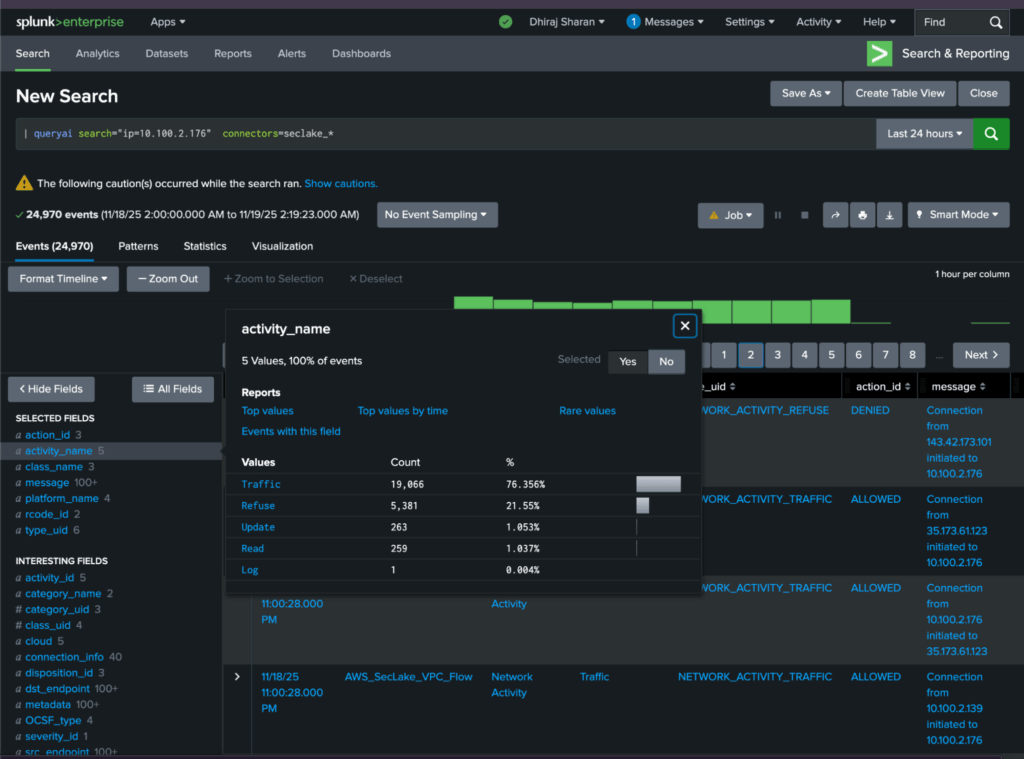
Analysts validated that they can do focused join-searches from the Splunk console for entities and specific activity tied to those entities. This includes searching by common cybersecurity entity data types like ip, hostname, username, email, file_hash, resource_id, and more. For example, here is how one analyst searched for a particular IP in parallel across all the nine sources:
| queryai search=”ip=x.x.x.x” connectors=seclake_*- NOTE: The star wildcard in
seclake_*means that the search was executed in parallel across all nine connectors :seclake_cloudtrail_useast,seclake_route53_useast,seclake_vflow_useast, …and the like.
EVENT INVESTIGATIONS
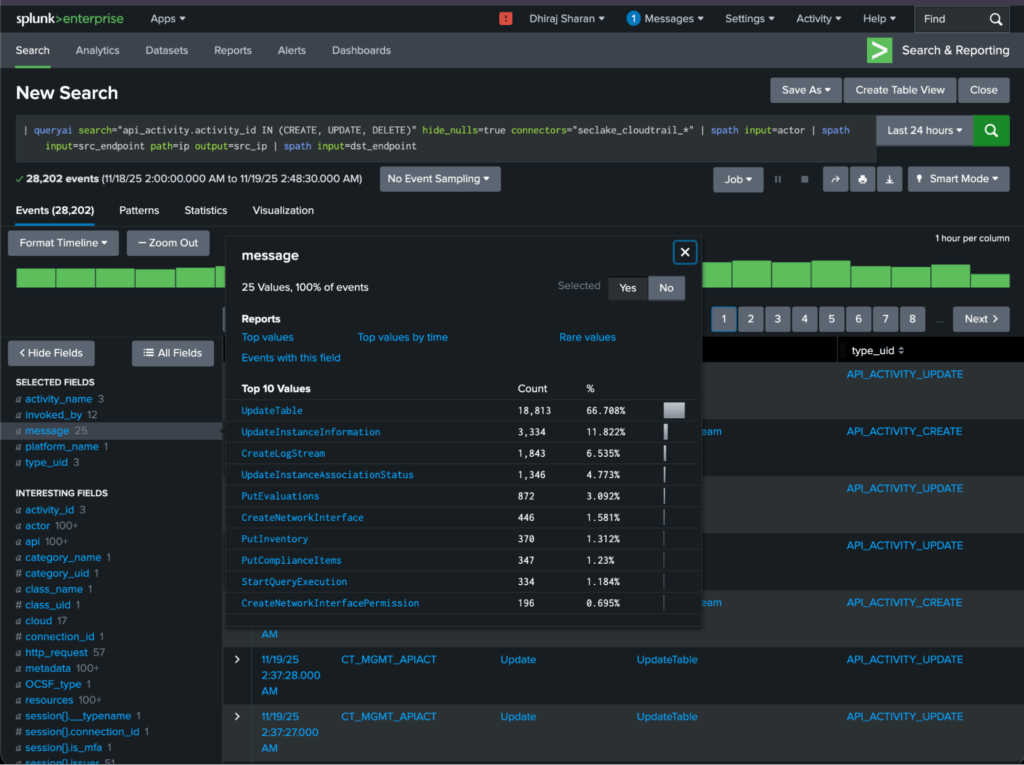
Analysts validated that they can search by any combination of event attributes to look for needles in the haystack. For example, as part of an active investigation, one analyst used the connector for CloudTrail logs in Security Lake to look for which users modified which specific cloud resources:
| queryai search="api_activity.activity_id IN (CREATE, UPDATE, DELETE)" connectors="seclake_cloudtrail_*" | spath input=actor | spath input=src_endpoint path=ip output=src_ip | spath input=dst_endpoint- NOTE: The search results can be processed further via standard SPL. For example, the
… | spath input=...command above, extracts fields from the input object json’s sub-fields.
FEDERATED DETECTIONS
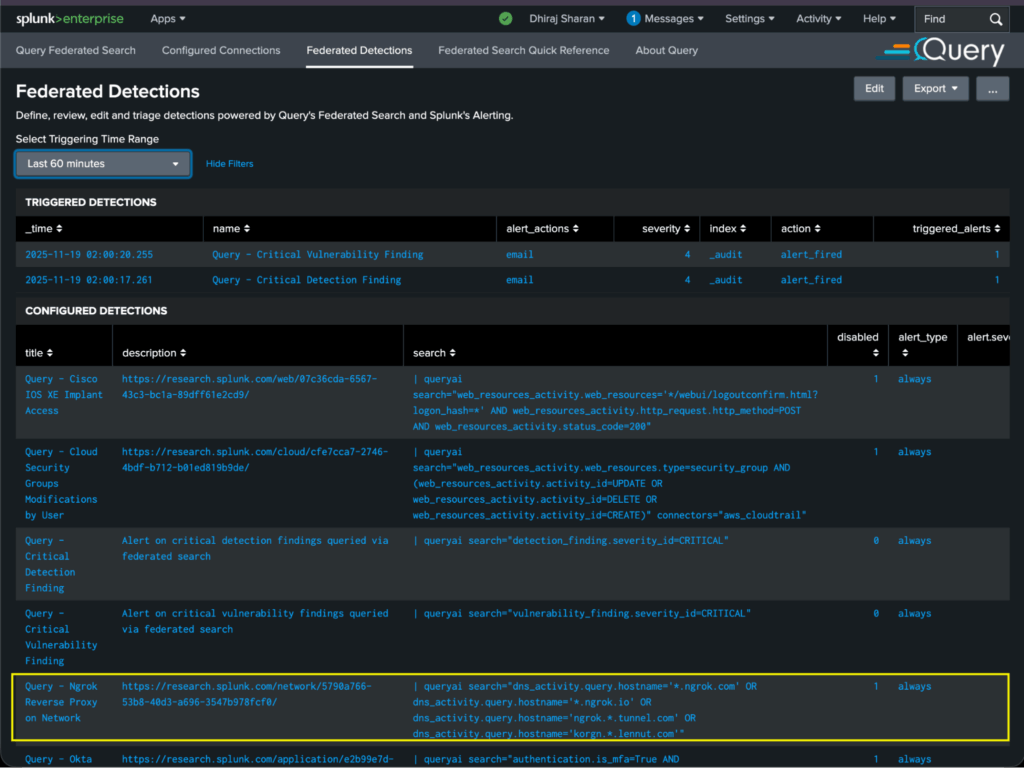
A detection engineer on the team wanted to validate how their current detections that are defined and managed in Splunk, would run without moving data from Security Lake to Splunk. They were already using several detections written by Splunk’s Threat Research team (see https://research.splunk.com/detections/). These detections were based on Splunk’s Common Information Model (CIM). Query helped the customer modify the detection logic to move to OCSF – in most cases the OCSF normalization simplified the logic further. For example, this particular existing detection Detection: Ngrok Reverse Proxy on Network | Splunk Security Content alerts on unauthorized usage of the Ngrok reverse proxy. Here is how it was adjusted to use | queryai command and with OCSF data model:
| queryai search="dns_activity.query.hostname IN ('*.ngrok.com', '*.ngrok.io', 'ngrok.*.tunnel.com', 'korgn.*.lennut.com')" connectors=seclake_route53_*- NOTE: The DNS Activity data model can be referenced here.
SPLUNK VIEWS AND DASHBOARDS (with inputs and the ability to drilldown)
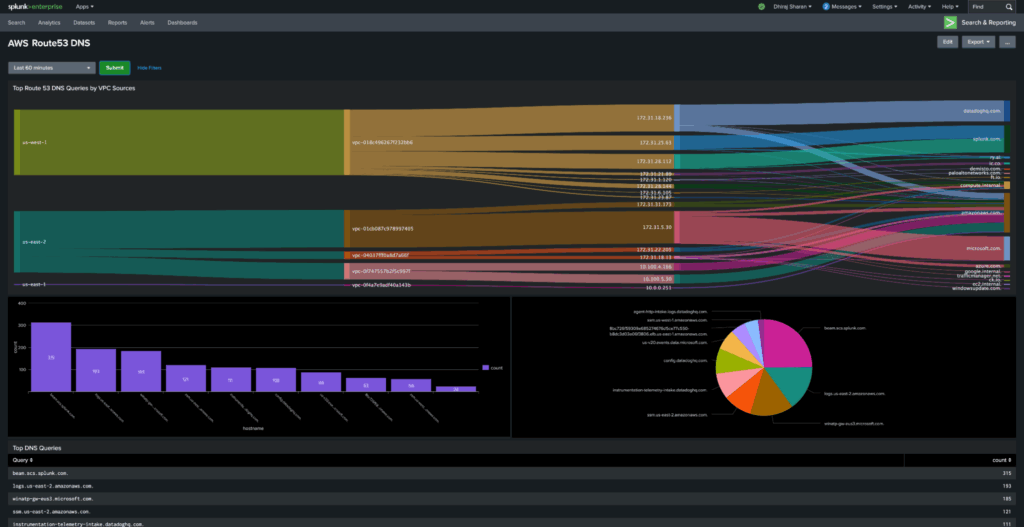
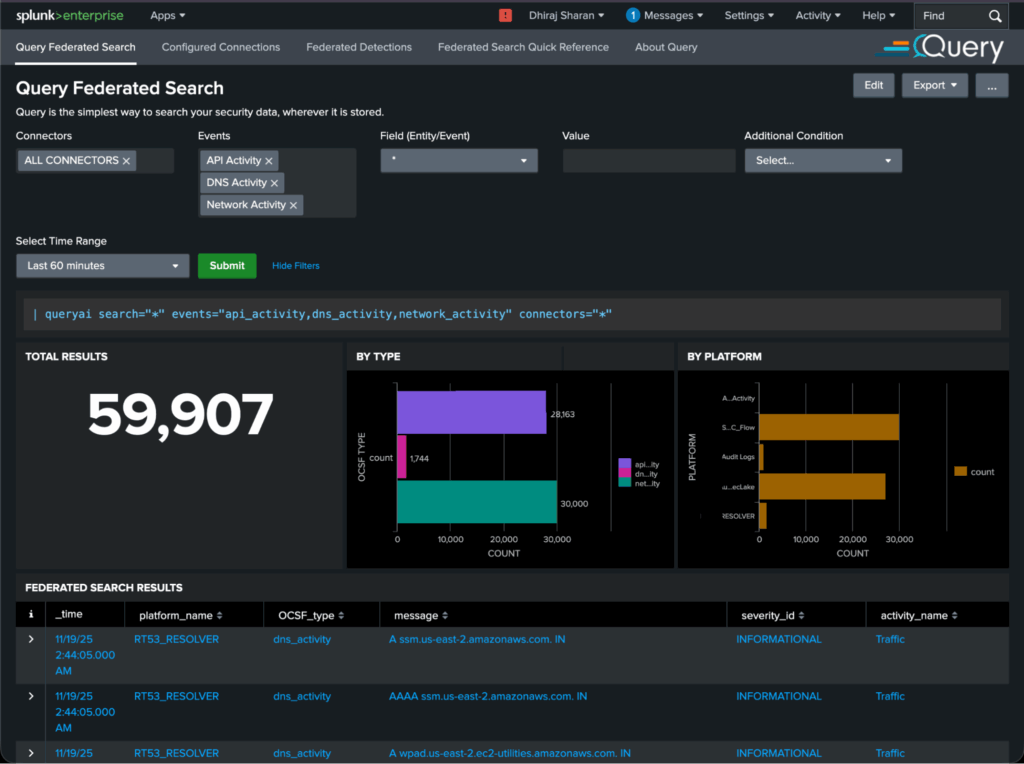
Query Splunk App has built-in views, and Query also provided the team with sample dashboards that they could easily customize, with ability to expose form-based user inputs.
- For example, one tier-1 analyst wanted to investigate top Route 53 queries by VPC source. The relevant dashboard is here:
- Another example – analysts wanted a Splunk view to monitor disparate sets of events together, along with a form-based input to filter results. This is how it looked, with ability to easily select event types in the UI, the AWS regions (via region names built-into connector selector), and optional inputs to filter further by specific event attributes:
POC Outcomes
Through the POC with the Query security data mesh, the customer validated that all their requirements were met. Overall, the POC led to several compelling outcomes for the customer:
- Familiar analyst workflow preserved. Analysts stayed in Splunk and used the same SPL workflows (with adjustments to use
| queryai …). There was no new UI to learn. (NOTE: Query has an optional standalone UI for analysts.) - Extended visibility. The SOC now had access to wide-ranging Security Lake data (hosts/network/cloud) without needing to ingest into Splunk. They could search across event classes and regions in one place. With this success, their production plan is to connect to more sources logging to Security Lake across 16 AWS regions:
| Source | Event Class |
| CloudTrail Lambda Data Events | API Activity |
| CloudTrail Lambda Management Events | API Activity, Authentication, Account Change |
| CloudTrail S3 Data Events | API Activity |
| Route 53 | DNS Activity |
| Security Hub | Vulnerability Finding, Compliance Finding, Detection Finding |
| VPC Flow Logs | Network Activity |
| EKS Audit Logs | API Activity |
| AWS WAF v2 Logs | HTTP Activity |
NOTE: You can learn more about event classes here.
- Predictable and cost-efficient solution. By keeping large volumes of data in Security Lake and querying via federated search, the customer avoided the cost of indexing everything into Splunk. Instead of paying for expensive and unpredictable Splunk license growth, they leveraged low-cost storage + Athena queries. Query is licensed by the number of connectors and is not tied to data volume. It can be procured from the AWS Marketplace as part of your AWS spend.
- Unified and normalized search. Because Query maps to OCSF and normalizes fields across sources, the analysts could search by a single host or IP and see results across all tables, without needing custom unions or joins. For example, an IP that showed up in CloudTrail and VPC Flow Logs is easily part of the same unified entity search.
- Faster time to investigate. With the federated search, they could investigate or hunt quickly, iterate, and pivot, instead of waiting for heavy ingestion or custom data engineering.
- Detections on remote/distributed data. The customer was able to automate and run their existing detections via the mesh on the decentralized distributed data in Security Lake across their different regions. Splunk’s own solution would have forced the customer to centralize data to run detections, whereas Query let them run over remote data.
- Scalable future-proofed architecture. The architecture validated in the POC, set them up to move other third-party and custom sources out of Splunk indexes and into Security Lake. Logs could be onboarded from additional sources (SaaS logs, endpoint telemetry, etc.) into the mesh, with minimal change to analyst workflows. Query also supports directly onboarding data from 50+ native platforms, staying truly distributed (without having to centralize). Over the next 2-3 years the organization envisions a gradual transition away from ingest-heavy SIEM to a federated data-mesh architecture.
Summary
This customer success story demonstrates how an enterprise with an existing Splunk-based SOC and a growing need to extend visibility across cloud sources in 16 global AWS regions, used Query to transition their security data into Amazon Security Lake.
By leveraging the capabilities of Query federated search:
- They maintained their analyst workflows in Splunk.
- They kept data in place in their local regions’ Security Lake (meeting compliance while also avoiding heavy ingestion/licensing cost).
- They enabled fast, normalized investigative searches across diverse logs.
- They set up a scalable architecture to support future growth and detection use-cases.
The result: extended visibility, faster investigations, cost-efficient architecture, and minimal disruption to the existing SOC.
For organisations looking to bridge Splunk with Amazon Security Lake (or other data lakes) this success story shows a pragmatic path: keep what works, extend where needed, and let the Query security data mesh tie the parts together.
