
Over the last few years, the Snowflake AI Data Cloud has become an increasingly common data lake platform for cybersecurity data. Security analysts are typically most comfortable operating in their traditional SIEM (which is frequently Splunk). As Snowflake has gained adoption as a destination for security data, analysts find themselves pivoting from Splunk to Snowflake during investigations. That pivot represents a chasm that is difficult to bridge without a security data mesh solution like Query.
Today, let’s walk through how an organization facing that problem went about evaluating different approaches and eventually found success using the Query Security Data Mesh.
Customer Environment, Use Case, and Project Goals
This organization had been using Splunk for years but had made a business decision to avoid putting new data sources into Splunk. While cost was a big factor in the decision, the main factor was their desire to create a common data lake service for all internal consumers. The CISO partnered with the CIO in creating a Snowflake-based data lake that would host all kinds of log, IT, application, and security data, with all of it to be made available as an internal service. These consumers span across the organization, covering the SOC team to IT Ops and multiple application teams.
As a large organization operating for many years, they have heavily adopted two of the major cloud providers across regions in North America. While their Snowflake service is a giant lake, in effect it is a virtual lake made of ponds, deployed across regions and cloud providers. The customer had adopted this architecture to minimize egress costs and keep their data within the local region and cloud provider.
The problem they were trying to solve is that analysts live in Splunk but now had to pivot into the ponds referenced above to run individual investigative queries, and then manually collate relevant results. We heard that even MS Excel is in use during investigations!
The security team had heard of terms like “data mesh” and “federated search”, so this is when the CISO sanctioned a project to explore solutions. Since the analysts’ playbooks were heavily built around Splunk over the years, the desired solution was something to bridge Splunk with Snowflake with Splunk being the analyst console and Snowflake being the data source.
Security Data Mesh Architecture with Query
Some web research for “security data mesh” and “federated search” landed their security architect on Query’s website. In addition to Query, he also found that Splunk has a federated search solution so he wanted to explore and possibly test both options.
After gaining an understanding of the Query Security Data Mesh and getting a demo of the Query Splunk App, there was excitement to get a POC going. The customer was drawn to how Query enables investigations from the Splunk console without needing to index data into Splunk. With the Query Security Data Mesh architecture, data stays in place in Snowflake and does not move. It is accessed live on-demand and only search results are sent to display in the Splunk console. Results are ephemeral and discarded once the user session is over, although the user can choose to store them in another location such as a Splunk summary index, if desired.
Scoping the POC
The organization contacted and worked with the two selected vendors – Splunk (for their federated search solution), and Query.
POC with Splunk’s Federated Search
This ended up being a non-starter. The customer found that Splunk’s own federated search was designed to search only across Splunk-indexed data residing in multiple Splunk instances. If the customer took this path, they still would have to pay for the base ingestion costs and then additional fees for the federated search capabilities. They learned that while Splunk’s federated search supports two additional sources – Amazon S3 and Amazon Security Lake – it won’t support data stored in Snowflake until July of 2026.
The customer then chose to move forward with testing Query Federated Search, detailed below.
A comparison with more detail on the differences between Query & Splunk Federated Search can be found here.
POC with Query Federated Search
Query already supports Snowflake, providing an easy-to-use interface to map data from multiple Snowflake tables and then search them in parallel. It takes care of query planning, query translation, query execution, and unioned windowing of results from all tables. Query requires read-only access and does not allow users to submit dangerous or overly broad SQL queries to your Snowflake warehouse. On top of that, Query supports over 50 additional security data sources that can be operationalized using the security data mesh. These additional sources can be used for enrichment, for additional context, such as identity and asset information, or even to create federated detections from Splunk.
While the customer was planning to run their POC with the Query Splunk App connected to their Snowflake data sources, the Query team enabled them with a tenant that already had sample Snowflake data. That helped fast track the testing experience without having to wait for internal access approvals.
Over time, the customer added more Snowflake sources from across their multi-region, multi-cloud environment and removed the sample Snowflake sources, thus transitioning their tenant smoothly from POC to production. With the Query Security Data Mesh operating as middleware, the customer’s analysts don’t leave their Splunk Console and use regular SPL in Splunk Search, Dashboards, and Alerts to operationalize their relevant Snowflake data. Alternatively, they have the option of using Query UI, if they desire to move away from Splunk completely in the future.
Next, we’ll cover the technical details of how the data connection and testing of the customer use-case was done.
Configuring the Connection to Snowflake
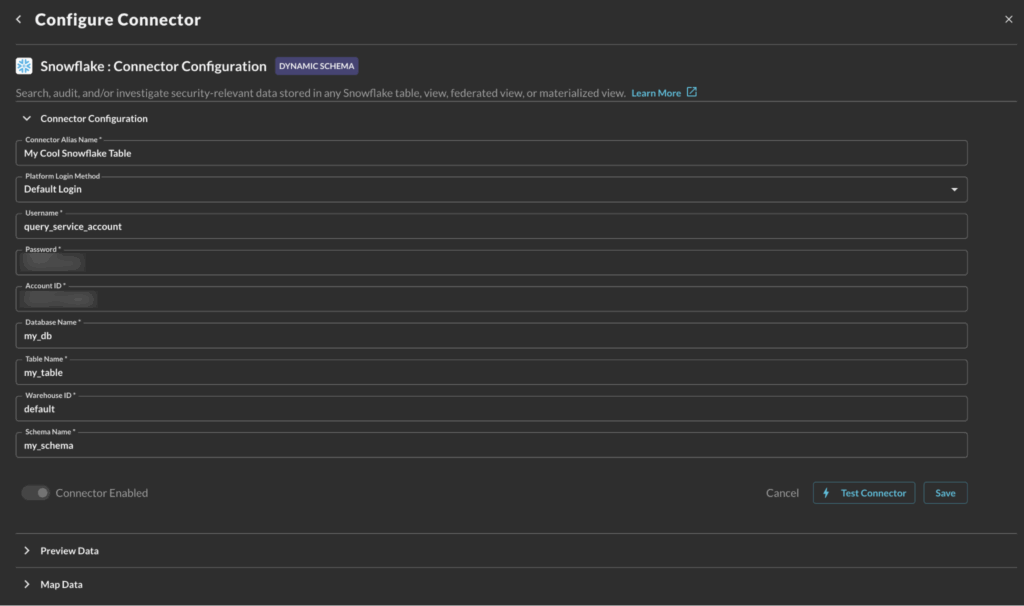
To make any data available to the Query Security Data Mesh, you enable an API connection to that data source, ie. Snowflake in this case. There is a simple UI form where you provide:
- Snowflake Account ID (is a combination of Organization Name and Account Name)
- Username of the designated service account for the integration and its programmatic access token (alternatively, RSA Private Key or Passphrase-based authentication is supported as well)
- What data to connect to, i.e. Database Name, Table Name, Warehouse ID, and Schema Name. This step is repeated for each data source in the above account.
For a detailed guide to onboard Snowflake data on Query mesh, please refer to Query documentation for Snowflake Connector.
Mapping Data From Multiple Snowflake Tables With Query Copilot
For each table with security-relevant data, the next step is to map that source data schema to the Query Data Model, which is based upon the Open Cybersecurity Schema Framework (OCSF). Mapping the source data to a relevant OCSF security event makes it addressable as part of the distributed security data mesh. OCSF is a common industry data model that Query uses for events and objects on its mesh. (To learn more, please read Query Absolute Beginner’s Guide to OCSF.)
Query has a Copilot-assisted schema configuration wizard that applies the normalization automatically. A customer admin has the opportunity to review and customize the event mappings, if desired.
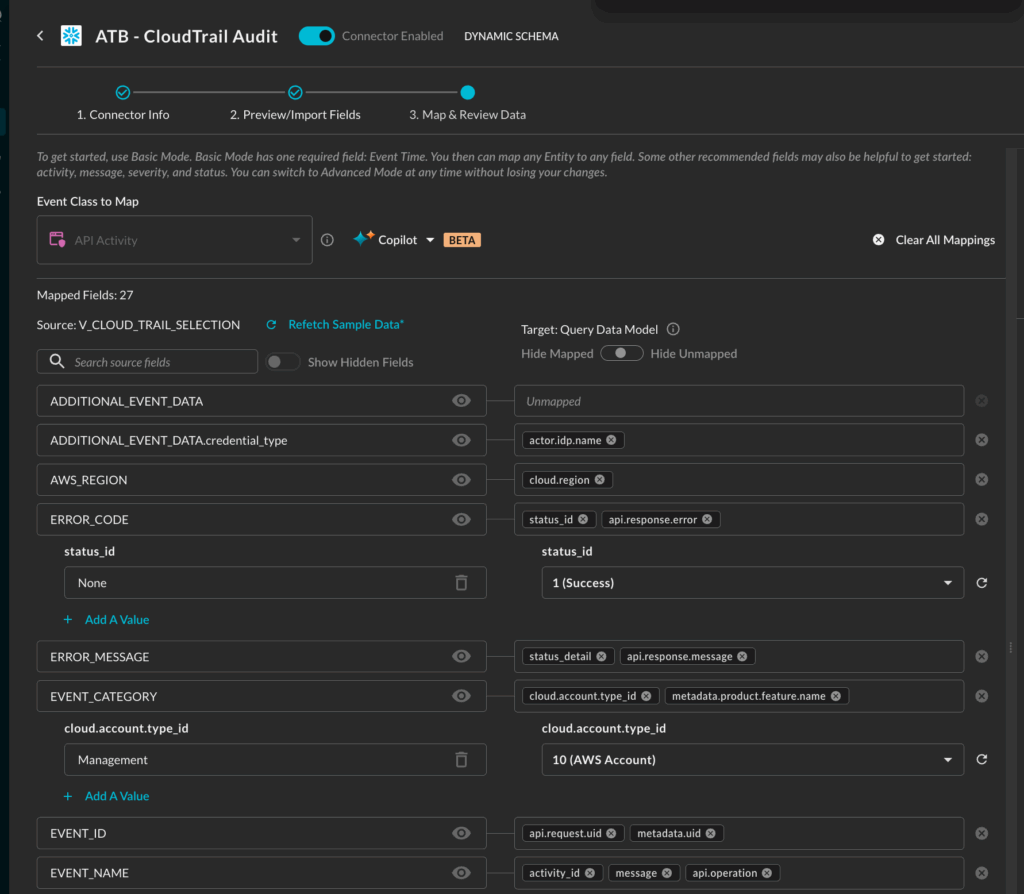
The screenshot above shows how the Query Copilot auto-mapped V_CLOUD_TRAIL_SELECTION – the customer’s AWS CloudTrail table in Snowflake – to the API Activity event class in the Query Data Model. (NOTE: above mapping screenshot is of a partial set of fields.)
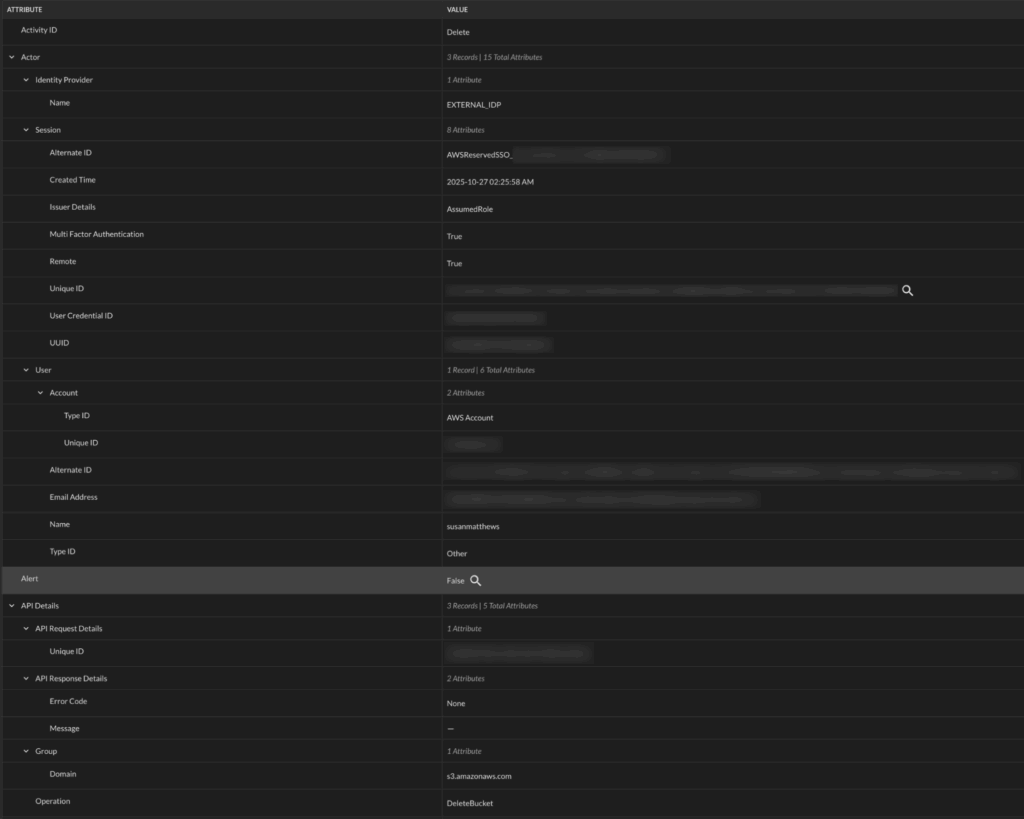
Following data mapping, here is how an API Activity event looks in the Query Console:
Searching From the Splunk Console
The customer’s Splunk admin installed the Query Splunk App following this guide. The app made it possible to run federated searches on remote data sources, without needing to index into Splunk. The app extended SPL with | queryai command for searching, and yet, it allowed their Splunk users to continue to run their standard SPL pipeline commands.
Example Spl From Splunk: Investigating Cloudtrail for Any User Activity That Modified Cloud Resources
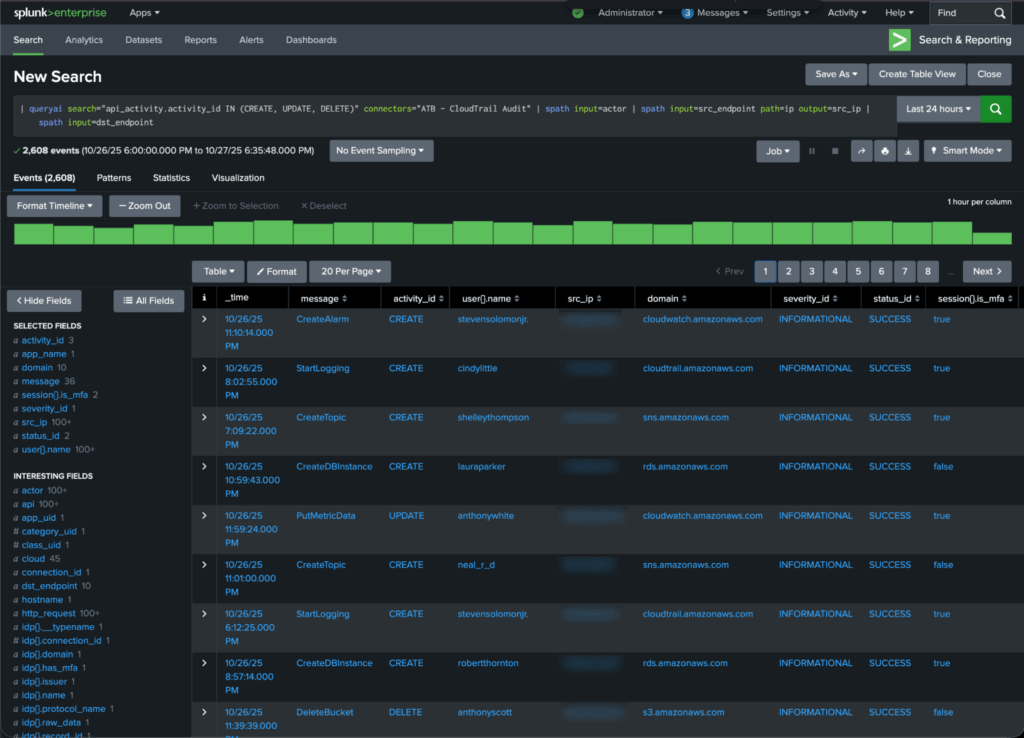
For example, here is a search the customer ran to investigate CloudTrail events that pointed to user activity where the user created/modified/deleted cloud resources:
| queryai search="api_activity.activity_id IN (CREATE, UPDATE, DELETE)" connectors="ATB - CloudTrail Audit" | spath input=actor | spath input=src_endpoint path=ip output=src_ip | spath input=dst_endpointNOTE: The … | spath input=... SPL command helps with extracting columns from the input object json’s sub-fields.
Here is how the tabular results of the query above look in the Splunk Console:
If needed, the customer could save focused results into a Splunk summary index with the … | collect SPL command.…
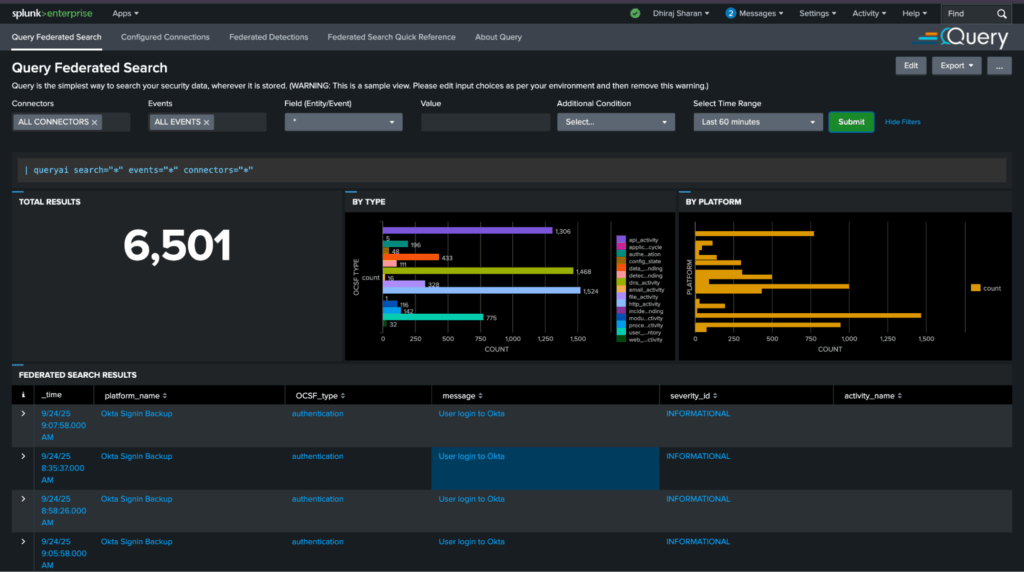
Investigative Views in the Splunk Console To Monitor Relevant Snowflake Tables Together
After getting the CloudTrail data above up and running, the customer similarly connected several other Snowflake tables holding security-relevant events. They were able to monitor those disparate sets of events together in different Splunk views and dashboards (alternatively, this is also possible via the Query UI). For example, here is a view to monitor all events by severity and type, with the ability to drill down:
POC Met and Exceeded Success Criteria. What Is Planned Next?
The customer deemed the POC a success as they achieved their key goals:
- Analysts don’t have to pivot out of the Splunk Console and manually run queries in Snowflake.
- Analysts can run their playbooks from the Splunk console and continue to use SPL.
- Reduced Splunk costs by routing data to the Snowflake data lake instead of Splunk indexes.
Currently they are moving to production with over 20 data sources stored in Snowflake.
Phase 2: Enabling Federated Detections
A post-production, phase 2 goal is to enable federated detections for some of their custom playbooks in Splunk. The customer’s desire is that data should remain stored in Snowflake but detections should be authored and managed in Splunk. Triggered detections also need to be triaged in Splunk.
Query supports their phase 2 use-case and we’ll cover the details in a future blog.
Further Technical Information on Using the Query Security Mesh With Snowflake
For the technical audience wanting to learn more about how Query works with Snowflake, please read these two blogs written by my colleague and SecDataOps expert Jon Rau. These go deeper into data architecture and engineering using Snowflake as your security data lake, Query as your security data mesh middleware, and the Query UI or Splunk App as the console for security analysts.
- Snowflake and Query: Better Together for Security Outcomes
- Federated Search from Splunk to Snowflake (and More) – Query
Summary
In this Customer Success story, we learned how Query enabled a customer to leverage Snowflake as their security data lake, while simultaneously continuing to use Splunk as their security console. We covered how the Query Security Data Mesh connected to the customer’s Snowflake environment, how data was mapped from the source to the Query Data Model, and examples of how end user SOC analysts leverage queries and dashboards from the Spunk console they were familiar with.
If you’d like to learn more or see how Query can help connect your Splunk tenant to distributed data sources, please reach out to one of our SecDataOps experts.