
Investigating vulnerabilities is painful yet absolutely essential work that the security team regularly does. Doing it manually quickly becomes overwhelming, so they typically integrate that as part of their SOC workflows. Lets walk through such a scenario with a customer of ours, how they solved the problem with the Query Security Data Mesh, while staying with Splunk as their primary SOC view.
Customer Environment and Use Case
This organization uses multiple cloud environments across AWS and Azure. They have been using Splunk for years and the security team has a lot of processes built around Splunk as the primary investigation tool.
Cloud telemetry was not being sent to Splunk because of licensing costs. Most data was split between two lakes for each cloud provider:
- Amazon S3 contained a lot of parked data with AWS Security Hub data being of immediate interest.
- Azure Data Explorer (ADX) similarly contained a lot of parked data but Microsoft Defender for Endpoint (MDE) was of primary interest to the customer. (Note that the customer had chosen to store into ADX vs Azure Log Analytics for their internal reasons.)
Analysts were used to SPL and thus were not keen to run SQL (via Athena) and KQL queries directly into the above lakes.
The use case coming from the CISO was to create and improve processes on monitoring and acting on vulnerabilities in their cloud hosted systems. One metric was to be alerted around critical vulnerabilities within an hour.
They were exploring whether (a) to spend more on Splunk, or (b) set up a parallel SIEM starting with the above data. This would have been a split system but the intent would have been to eventually move over legacy Splunk data sources to it over several quarters.
Security Data Mesh Architecture with Query
The organization heard about Query’s Federated Search as an option through their Splunk Service Provider.
Upon understanding our Security Data Mesh architecture, how we enable investigations from Splunk without needing to move and index data into Splunk, they got interested in doing a quick POC.
The POC with Query Splunk App
The scope and goals of the POC were:
- Investigate Vulnerabilities in Cloud Environments.
- Analysts won’t leave Splunk Console.
- All investigations would be via SPL in Splunk Search and/or via Dashboards.
- Do not index more data into Splunk and stay within current license limits.
- Analysts won’t be going to Athena or ADX and won’t be running any SQL or Kusto.
- Prove automation and alerting over critical vulnerabilities so that analysts could be notified within an hour of a critical vulnerability getting detected in a cloud resource.
Getting to Lights On – Quickly
Post above scoping, all that was needed to get to lights on, i.e. access and investigate the vulnerability data from Splunk, was to do these steps:
- STEP 1: Access Query
- This got done in 30min within the scoping call itself as we created a tenant and invited designated customer admins via their corporate emails.
- STEP 2: Provide API Access to Sources
- ADX: The customer admin followed this guide to create a connection in Query. This did not involve any data moves, but simply the relevant API access parameters like Tenant ID, Client ID, Client Secret, etc.
- Amazon S3 (via Athena): The customer admin followed this guide to create the connection. No data moves, only API access.
- STEP 3: Enable Query Splunk App
- The Splunk admin enabled the Query Splunk App following this guide.
Note that for the initial setup, we let the Query Copilot auto-map the data from the native format into OCSF, the open industry standard security schema that Query uses. Customizations for advanced use-cases, if any, would be done at a later stage as per need.
The above steps were completed in only a couple of hours of time. The lag time was around finding the two right IT contacts for enabling the above access.
The First Search for Vulnerability Data
From Splunk search console, the very first search the customer ran:
| queryai events=*
Note: Query is available in SPL as | queryai custom command. For more details on how to search, see here.
The above search was executed by Query’s data mesh into the above two remote data lakes and the search results were brought back and displayed in the standard Splunk search console. The data was not inserted into any Splunk index (though that could be done easily as well with Query Security Data Pipelines, if desired).
Here is how the initial results looked:
Note that screenshots are from our mock setup and don’t show sensitive customer data.
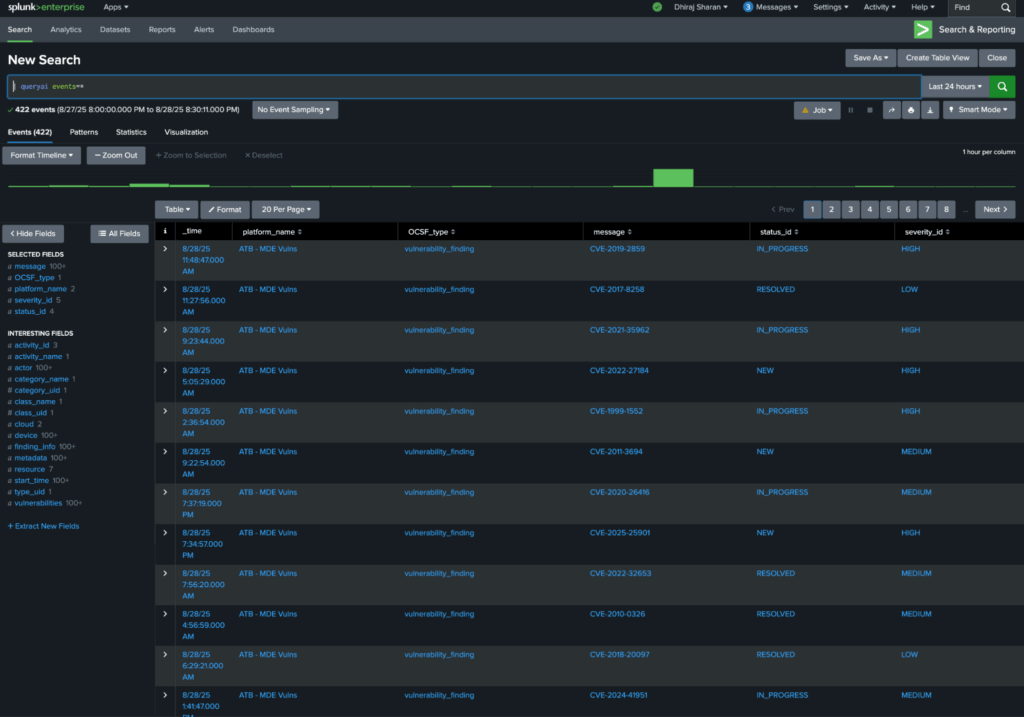
The above results represent data from both MDE and Security Hub normalized into OCSF vulnerability_finding events for cross-platform correlation.
Getting to actionable Results
With the POC up and running with relevant search results, the next step for the customer analyst was to get to specific critical vulnerabilities they wanted to explore and investigate.
The analysts had SPL knowledge and with some basic pipeline commands, they were able to extract the right fields from the OCSF object hierarchy.
For example, this command queried the two remote sources only for critical vulnerabilities, and then in the SPL pipeline, they extracted the details of the vulnerabilities object’s attributes and the device object’s attributes as per https://docs.query.ai/docs/event-vulnerability_finding to get to their fields of interest:
| queryai search="vulnerability_finding.severity_id=CRITICAL" connectors="ATB - MDE Vulns" | spath input=vulnerabilities | spath input=device
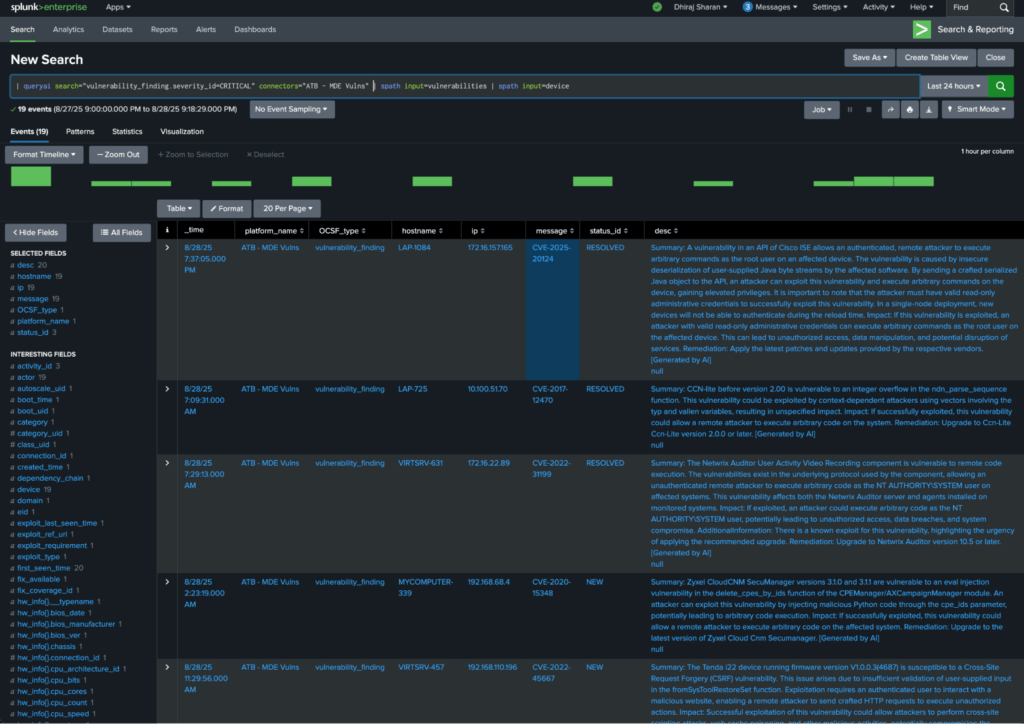
Above search listed all the vulnerabilities’ CVE, description, which IP/hostname it was reported for, and the current status of the vulnerability.
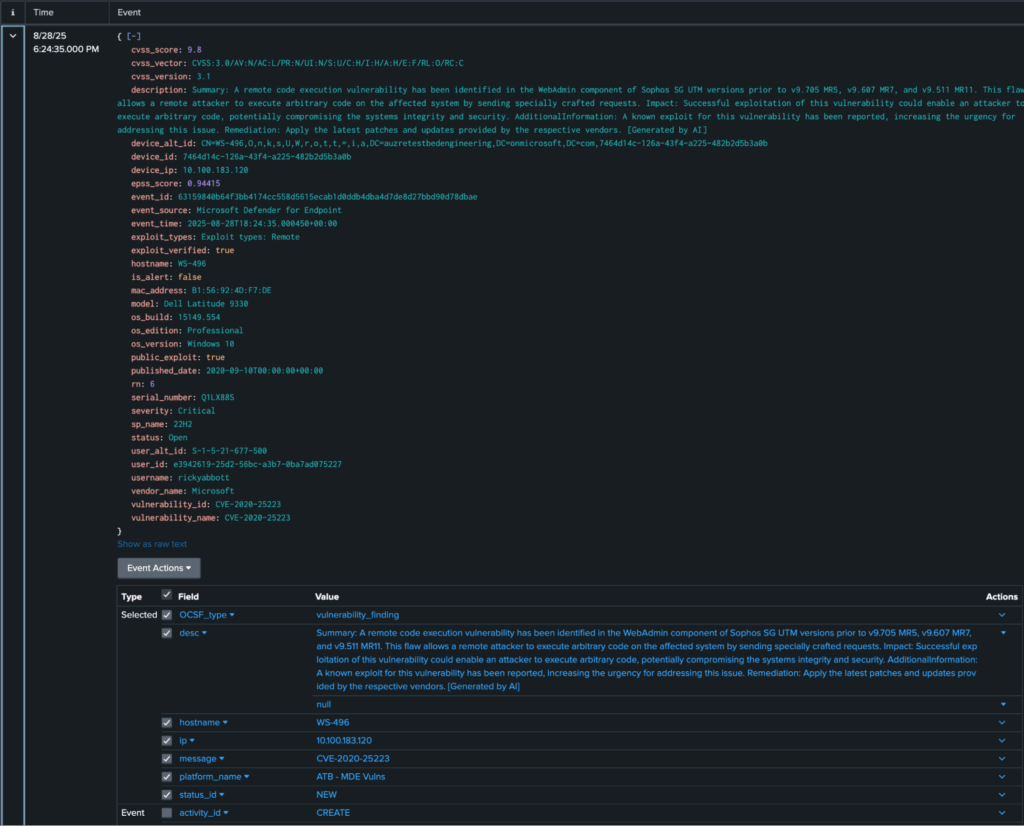
Full investigation from Splunk
The customer was able to easily get to the data and find new critical vulnerabilities. Here is the list view in Splunk showing full details of a remote code execution vulnerability in Sophos WebAdmin. This was the point they wanted to follow up with IT for patching.
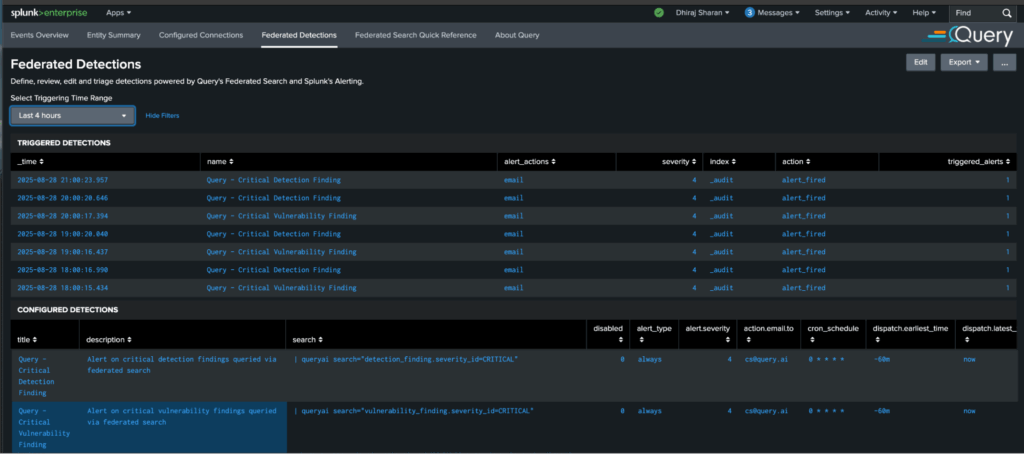
Automation and Alerting on Critical Vulnerabilities
Having achieved the primary goals of the POC, the icing was to enable and test their existing automation workflows pre-built into Splunk to act on this remote data via the Query Data Mesh, without bulk data moves.
Using Splunk’s in-built alerting, the customer enabled Query Federated Detections with the conditions they cared about. For example, take a look at this automation over critical vulnerabilities:
Summary
In this Query Customer Success story, we learnt about the customer environment and the problems they wanted to solve – multiple cloud accounts with their data in different lakes, too much data to put in Splunk, and the need to get visibility of vulnerabilities in cloud infrastructure.
Before coming to Query, the customer considered options of either increasing Splunk license or adding a second SIEM. Eventually they tested Query and found that Query Security Data Mesh was able to solve their use-case in an elegant manner without major cost increases, and with keeping their existing use of Splunk as the analysts’ console.
For more information on above, please reach out.