
*Don’t have R installed yet? Read my previous article to learn how: Statistical Computing: Installing R and RStudio
Introduction to R Language
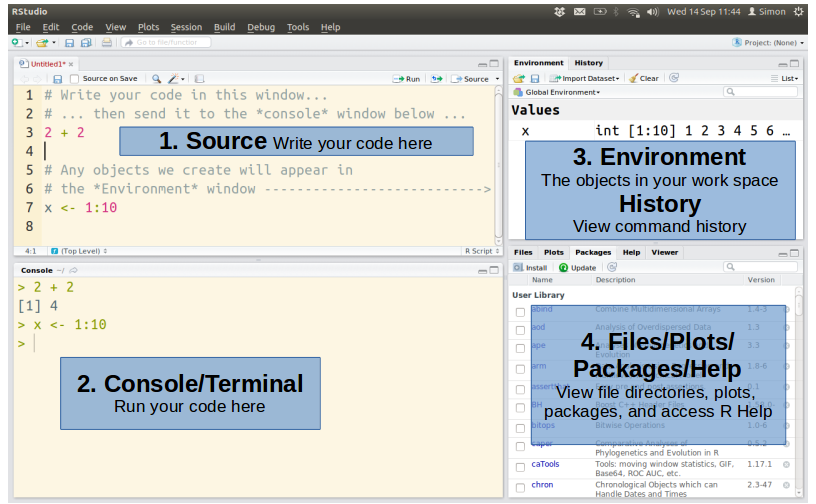
Click on File > New File > R Script
What to expect?
This blog will just give you pointers to R and kick start to “R”. Detailed R project documentation can be found for each section below.
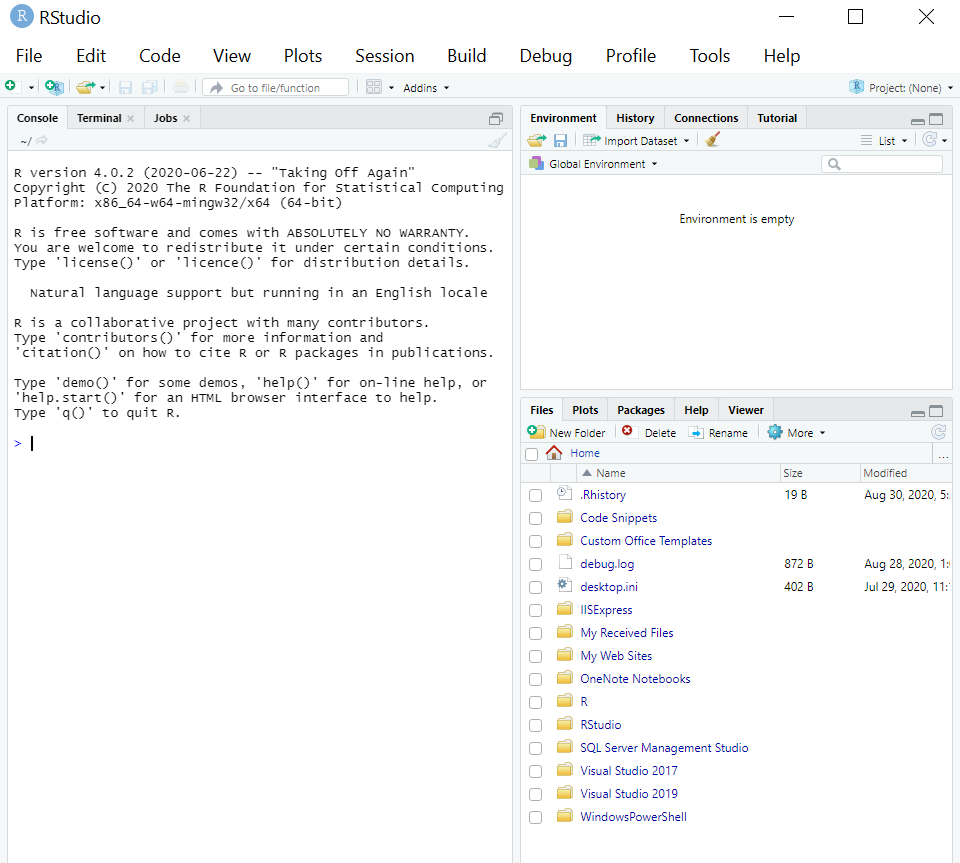
R Session
- Once the R is started, there is a console waiting for input. At the prompt (>), you can enter numbers, queries, etc, and perform calculations.
- How do we know we are learning a new programming language?
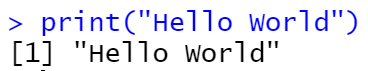
- In order to print Hello World in R, you have to pass the corresponding string in the print() function. the strings can be in double quotes “” or single quotes ”.
- It prints its argument and returns it invisibly i.e. it returns an invisible copy of an object.
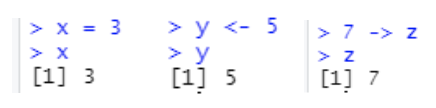
Variable Assignment
- There are 3 ways to assign value to a variable. “=”, “<-”, “->” are the ways.
Naming Conventions for Variables
- Variables must start with a letter, can contain “number”, “_”, “.”
- Variables can’t be keywords and are case sensitive
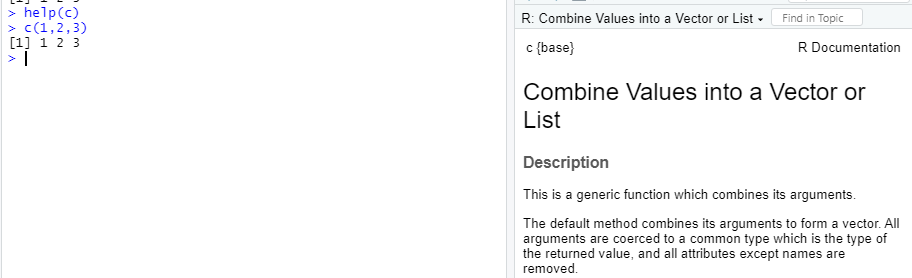
Getting Help
- R has extensive documentation.
- For example, “?c” or “help(c)” will provide documentation of the function “c” in R.
- Also, there is an R specific Internet search engine at http://www.rseek.org
R Arithmetic Operators
- An operator is a symbol that tells the compiler to execute specific mathematical or logical calculations.
- Operators are “Addition +”, “Subtraction -“, “Division /”, “Modulo %%”, “ Multiplication *”, “Exponentiation ^”
Comments
- “#” is added as a comment and will be ignored by R
Basic Data Types in R
- Numeric: Decimal values, natural numbers (also known as Integers) are numeric. Eg: – 3,3.5
- Logical: A logical value is created by comparison. Eg: – TRUE or FALSE
- Complex: A complex value is defined via the imaginary value i. Eg: – 1+2iThere are 4 basic data types: Numeric, Logical, Complex, and Characters
- Characters: A character object is a string value. Eg: – “3.14”, “John Doe”
R Data Structures
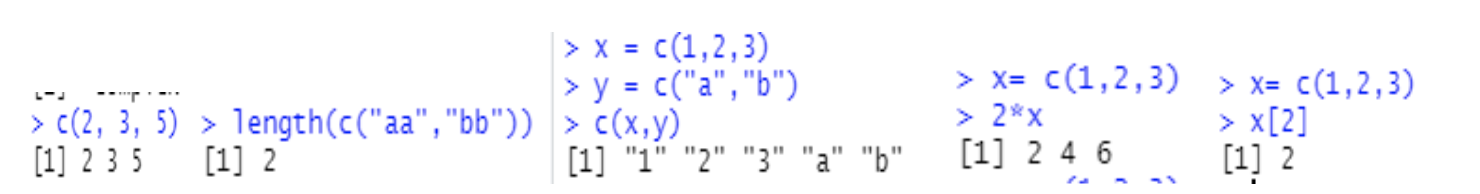
Vectors:
- Vectors hold a single type of data. It is the sequence of data elements of the same data type.
- Two vectors can be combined. To maintain the primitive data type, values are coerced.
- Arithmetic operations can be performed on vectors member by member.
- Specific member can be obtained using index i.e.
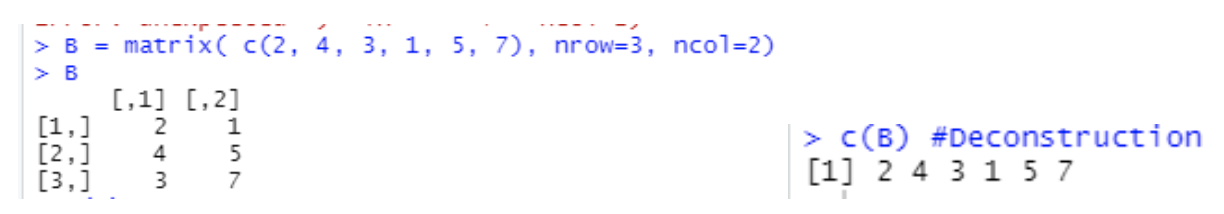
Matrix:
- Its an arrangement of elements in row-column format.
- The matrix allows arithmetic operation on them.
- You can combine two matrices with the same number of rows.
- R allows you to construct and deconstruct the matrix.
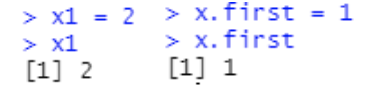
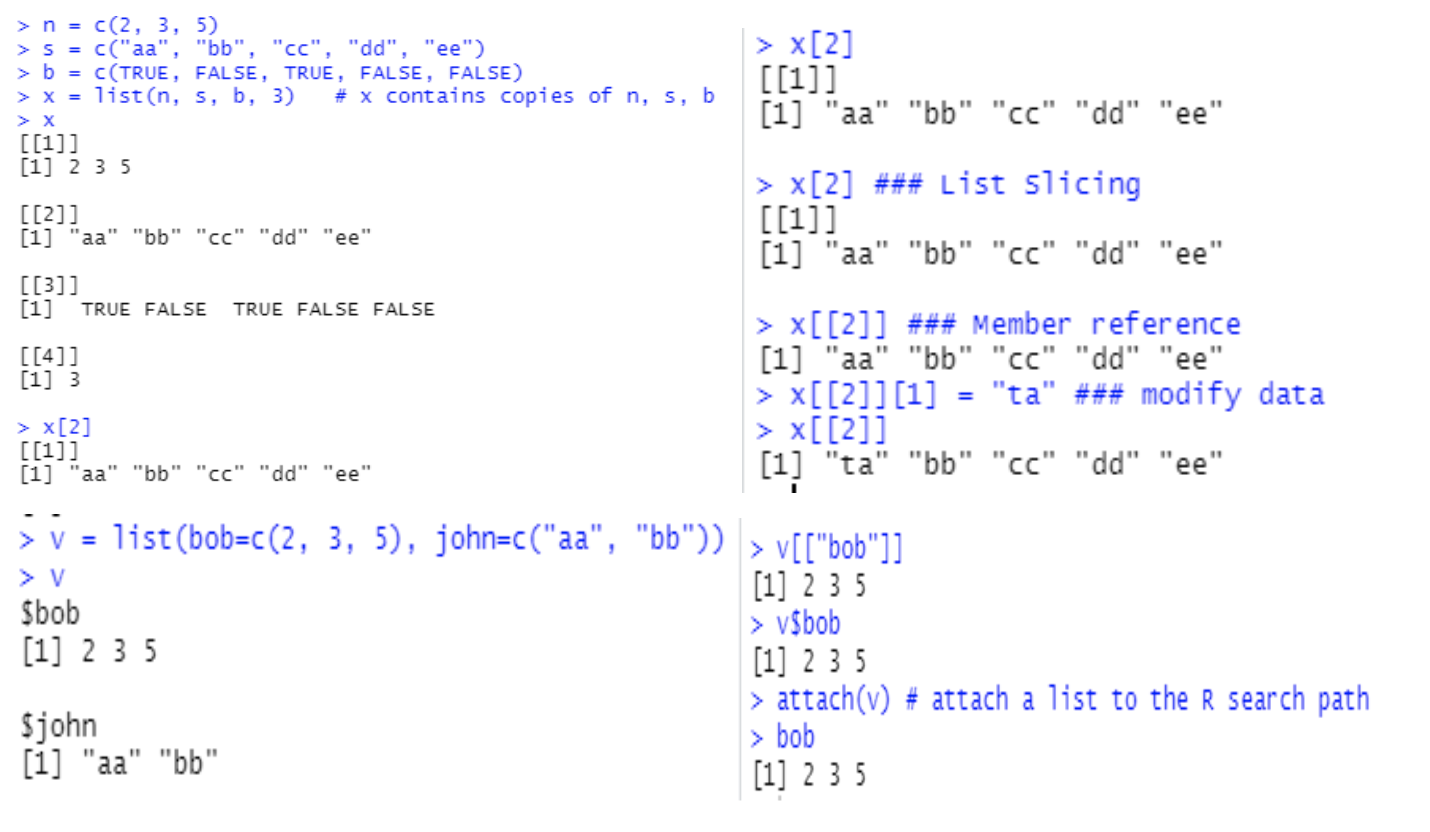
List:
- The list can store different data types. eg: Strings, Integers, Vectors.
- It can also store matrix, functions, etc.
- Names can also be assigned to the members of the list.
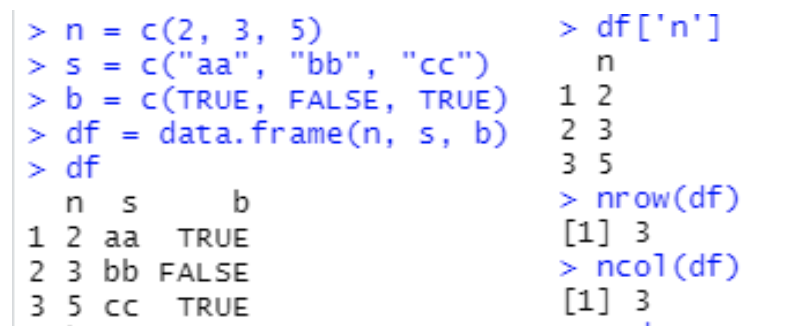
Data Frames:
- It stores the data tables.
- Here, every column is a vector.
- Moreover, these vectors should be of the same length and cannot be empty.
- Like list, data frames can be sliced row-wise, column-wise, can have named index, numeric index.
- Data frames can be imported. The format can be CSV, Excel, Minitab, spss, table file, txt.
R Control Structures
Control structures control the flow of a program. Below are the control structures:
- If-else statements
- Switch
- While loops
- Next statement
- Break statement
- For loops
- Repeat loops
Functions:
- Functions in R are created with the keyword “function”. Here is the list of important parts of a Function in R
- Function name
- Function body
- Arguments
- Return statement

Advanced concepts of R
After gaining some insights on the basics of R, let’s move onto the advanced concepts of R so that you’ll be able to apply it in data science.
Principle component analysis:
- This technique used to reduce the number of variables in a dataset.
- So this is also called a multivariate analysis technique.
- The aim here is to lessen the count of variables to be analyzed without changing the data carried by them.
Factor analysis:
- This technique is also used to lessen the count of variables that needs processing.
- Factor analysis makes the calculations easier and less resource-oriented.
Hypothesis testing:
- This technique helps in confirming assumptions which are drawn from the data set.
Graphical models:
- These techniques help in visualizing the data.
Debugging functions:
- R has many pre-defined debugging functions.
Decision trees:
- It is a machine learning algorithm. This technique is quite popular in data mining. It is majorly used for solving decision-making consequences.
Linear Regression:
- This helps in finding the linear relationships between two quantities or variables.
Logistic Regression:
- This is a non-linear analysis technique.
- It tries to determine the non-linear relationships between a set of variables.
- It mainly is concerned with categorical data.
Clustering:
- This technique is used to create clusters of similar types of data.
- This plots the data in a graphical space and identifies the clusters of observations that are close together and, therefore, may have similarities.
Classification:
- This technique is used to classify the data based on some aspects or characteristics.
- This groups the observations.
Data Analysis:
- Like already discussed in the previous blog Statistical Computing: Installing R and RStudio, one of the main features of R is data analysis.
- It is a way of applying statistical/logical techniques to data to describe, Illustrate, and represent data.
- In other words, making sense out of Data.
- Historically, businesses have used data analysis to monitor their overall performance and to better understand factors that drive that performance for eg: customer preferences and purchasing habits.
- Data analysis can also be used to identify cybersecurity threats, risks, and incidents, helping businesses become safer and less vulnerable to cyber attacks like Phishing attacks, Content Security Policy, Fraud detection.
- How to Analyze the data
- This allows us to make use of available tools to explore the data and find a pattern, in return it helps in making decisions and getting to conclusions.
- Data Analysis consists of the following phases:
- Data Gathering
- Data Collection Method
- Data Preparation (ETL)
- Data Crunching (Analyzing)
- Data Interpreting
- Data Visualizing
Conclusion:
In brief, we saw the basics of R, some samples, and pointers to advanced concepts.
We saw what data analysis is and the process of data analysis.
In part III, we will dig into cybersecurity with R.
SOURCES
https://cran.r-project.org/manuals.html
http://www.r-tutor.com/r-introduction
Introduction to R Online Course | DataCamp: https://learn.datacamp.com/courses/free-introduction-to-r
https://techvidvan.com/tutorials/r-tutorial/
Did you enjoy this content? Follow our linkedin page!