
Cisco IOS XE web UI zero-day announced October 19
On October 19, Cisco IOS zero-day vulnerability (CVE-2023-20198) was disclosed, impacting 40,000+ switches, routers, and access points running IOS XE. The vulnerability is in the web UI. See more at Hackers exploit zero-day to compromise tens of thousands of Cisco devices | TechCrunch.
You should check whether you are running any impacted Cisco equipment, including virtual devices in your cloud environment. Tools like Censys can be used to surface devices exposed and exploitable from the internet. Impacted customers can apply patches that have been released for multiple versions (see here).
Hackers have been exploiting the vulnerability since Sept. 18, and can execute any malicious command on the exploited devices. Hackers are targeting telecommunications companies who offer internet to consumers and SMBs, so the downstream spread is a significant problem.
For the latest on above, along with the list of IOCs that customers would have to look for, see the status updates from Talos (Cisco’s threat intelligence team) at Active exploitation of Cisco IOS XE Software Web Management User Interface vulnerabilities. Also see the CISA Alert at CISA Updates Guidance for Addressing Cisco IOS XE Web UI Vulnerabilities.
Second vulnerability announced October 24
While we were investigating above CVE-2023-20198, a second zero-day vulnerability was revealed on Oct, 24th in IOS XE – CVE-2023-20273. While the original vulnerability gave the hacker regular user privileges, the new one subsequently helps them get to root.
Track the latest on the new one at Multiple Vulnerabilities in Cisco IOS XE Software Web UI Feature.
The above patch fixes both vulnerabilities, but you have to be on IOS XE 17.9 to use the patch.
Investigation and Remediation steps
The first remediation step is to apply the patch from Cisco Support and Downloads.
The next step is to investigate whether your IOS XE devices had the web UI feature enabled, and whether any of them were exploited between September 18th until your patching. If you have an asset inventory of your IOS XE devices and you have ssh access to each of them, you can follow steps from the Cisco advisory. But beware that to hide their trail, attackers have been observed clearing logs and deleting the implant account they created and used. Those factors necessitate taking the investigation to your SIEM / security data lake – let’s assume Splunk in our case. This way, even if you don’t have a known inventory of Cisco IOS XE along with ssh access, you can still search from system logs centralized in Splunk.
Using Splunk to investigate pre-centralized logs
Since Cisco now owns Splunk and Splunk is one of the most common SOC tools, we will use it here for a centralized investigation. We assume the IOS’s system logs were getting sent and stored in Splunk along with other logs typically centralized in a SIEM environment. If that was not the case in your environment, please refer to Cisco IOS XE System Management Configuration Guide to configure syslog forwarding of system messages.
Review system logs from your IOS XE hosts and look for log messages that indicate the following (log messages provided as per the Cisco advisory). Note that the Splunk index and field names used in the example searches below would be different based upon indexing and parsing configuration in your Splunk environment. Also, <user> could be any of cisco_tac_admin, cisco_support, cisco_sys_manager, …(or any user from the device)… :
- Check for IOS XE web UI enabled
Example Log:
%SYS-5-CONFIG_P: Configured programmatically by process SEP_webui_wsma_http from console as <user> on lineExample Search Term:
index=syslog process=SEP_webui_wsma_httpThe search results will help you identify what devices are having IOS XE with web UI enabled.
- Check for IOS account access by new or unknown user names. Also look for account creations/deletions.
Example Log:
%SEC_LOGIN-5-WEBLOGIN_SUCCESS: Login Success [user: <user>] [Source: source_IP_address] at 03:42:13 UTC Wed Oct 11 2023Example Search Term:
index=syslog “Login Success”- Check for file additions on the IOS system for unknown/suspicious files
Example Log:
%WEBUI-6-INSTALL_OPERATION_INFO: User: <user>, Install Operation: ADD <filename> Example Search Term:
index=syslog “Install Operation”- Check for IDS alerts pointing to exploit attempts
Ensure your IDS rule sets are up-to-date. Here is the search term, assuming Snort, with rule ids taken from above Talos blog.):
Example Search Term:
index=snort gid = 3 sid IN (50118, 62527, 62528, 62529, 62541, 62542)- Search for the three attacker IPs below (ref: above Talos blog) in your access logs.
Example Search Term:
index=<indexname> src_ip IN (5.149.249.74, 154.53.56.231, 154.53.63.93)Above would be a broader search in multiple Splunk indexes one-by-one, with the IP field changing, depending upon that data source.
For the above, we assumed that IOS XE system logs and IDS alerts were already getting sent to Splunk. But what if that’s not the case?
What if the system logs were not in Splunk?
Customers are often not sending system and network logs and IDS alerts to Splunk because of the associated costs of high-volume sources. While they mostly enable the capturing and logging of system logs via a syslog server, Splunk customers often end up parking the syslog in low-cost file storage or other compressed blob storage locations (e.g. Amazon S3). We mentioned earlier the reference on how to configure your IOS XE devices to send syslog to a syslog server. Further from there, there are no easy solutions to getting the data from the local syslog server into S3. It requires some scripting, and data engineering, and we feel it would require a dedicated guide on how to do that. If this is something you’re interested in, please drop a comment and we’ll prioritize that content. Otherwise, look for it in future blogs. The rest of this blog assumes that’s already happening in your environment.
So, under the above assumptions there are two options:
OPTION 1:
$$$$$ and insertion wait times
Start ingesting the historical data since Sept 18, either directly from the relevant hosts or from the above blob store, into Splunk so that you can centralize to investigate.
When a zero-day is disclosed, the security team is expected to quickly produce an assessment on whether the organization is impacted for executive leadership. That is a critical time period, and you do not want to be forced to wait several hours, or sometimes days, to ingest historical data.

You would also have to update your Splunk license to safely ingest that volume. The feeling is best represented in this meme that was circulating during Splunk’s acquisition by Cisco.

So what would you do? Luckily, there is option 2!
OPTION 2:
Use Query’s Splunk App to run federated search on remote data
Use Query’s Federated Search for Splunk App. This app makes remote data sources (such as syslog messages stored in Amazon S3 blobs from our above scenario) immediately available for analytics in the Splunk search pipeline. That means no re-insertion delay and no further Splunk licensing costs.
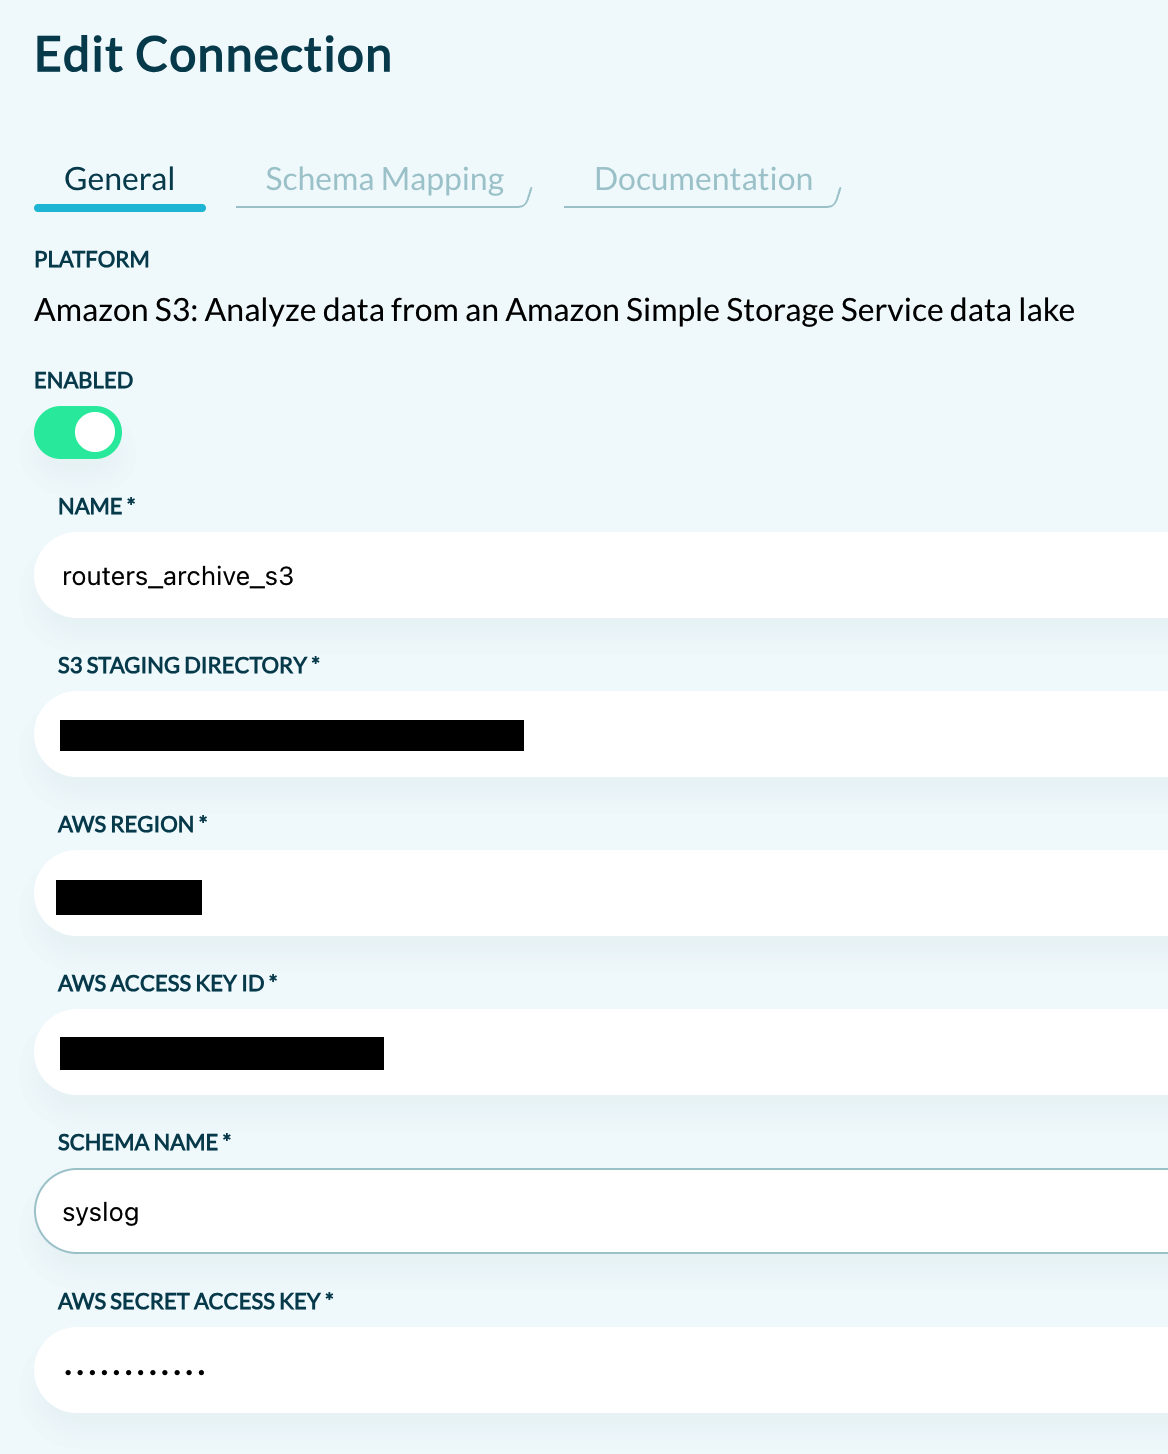
Assuming your environment had pre-configured IOS syslog forwarding and storage into a location such as Amazon S3, as discussed in the earlier section above, you will next configure a Query Connection to that data source as below: (NOTE: Integrations exist for other common data sources as well.)
Let’s look at how we would run the same four Splunk searches discussed in the previous section:
Here is how you can see the system messages, searching by the Cisco IOS XE device’s ip (or device name in dvc field):
| queryai search="ip = 192.168.1.100" platforms="routers_archive_s3"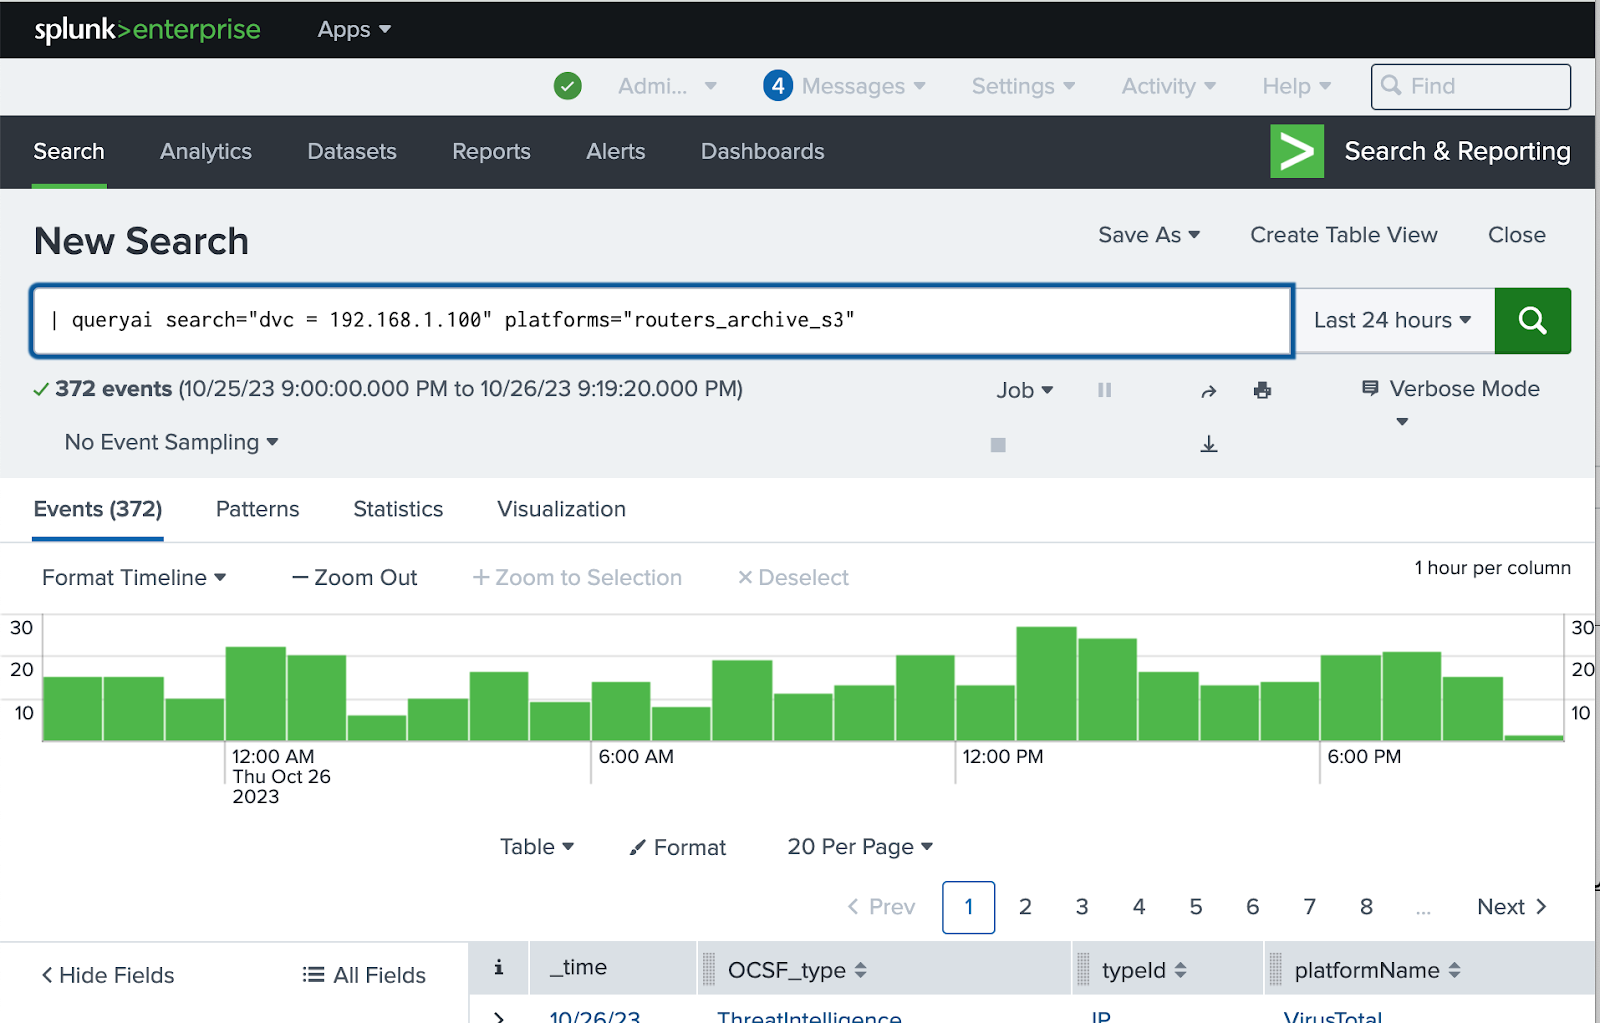
Here are the equivalent searches for the same five steps we discussed above, where data comes from a remote location queried via federated search:
- Check for devices with IOS XE web UI enabled
| queryai search="file=SEP_webui_wsma_http" platforms="routers_archive_s3"- Check for IOS account access
| queryai search="ip = 192.168.1.100" platforms="routers_archive_s3" | search message=”*Login Success*”- Check for file additions
| queryai search="ip = 192.168.1.100" platforms="routers_archive_s3" | search message=”*Install Operation*”- Check for IDS (Snort) alerts
| queryai search="ip = 192.168.1.100" platforms="snort_archive_s3" | search gid = 3 sid IN (50118, 62527, 62528, 62529, 62541, 62542)- Search for attacker IP IOCs (replace <ip> with the attacker IPs one by one):
| queryai search="ip = <ip>"Here is a quickstart from Query’s documentation on Running Federated Search from Splunk.
Please reach out, if we can help with the above approach!